
 | ||
In Statistical Process Control, the Western Electric Rules are decision rules for detecting "out-of-control" or non-random conditions on control charts. Locations of the observations relative to the control chart control limits (typically at ±3 standard deviations) and centerline indicate whether the process in question should be investigated for assignable causes. The Western Electric Rules were codified by a specially-appointed committee of the manufacturing division of the Western Electric Company and appeared in the first edition of its Statistical Quality Control Handbook in 1956. Their purpose was to ensure that line workers and engineers interpret control charts in a uniform way.
Contents
Motivation
The rules attempt to distinguish unnatural patterns from natural patterns based on several criteria:
- The absence of points near the centerline (identified as a mixture pattern)
- The absence of points near the control limits (identified as a stratification pattern)
- The presence of points outside the control limits (identified as an instability pattern)
- Other unnatural patterns (systematic (autocorrelative), repetition, trend patterns)
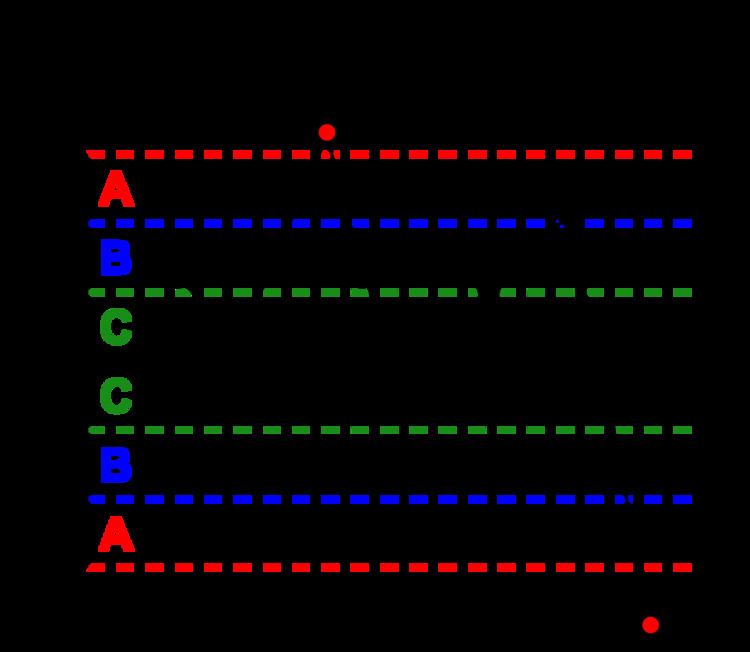
To achieve this, the rules divide the chart into zones, measured in units of standard deviation (σ) between the centerline and control limits, as follows:
Zones A, B, and C are sometimes called the three sigma zone, two sigma zone, and one sigma zone, respectively.
Zone rules
The most important of the Western Electric rules are the zone rules, designed to detect process instability—and the presence of assignable causes. There are four basic rules that deal with appraising runs of observations within the various zones:
These rules are evaluated for one side of the center line (one half of the control band) at a time (e.g., first the centerline to the upper control limit, then the centerline to the lower control limit).
Data satisfying any of these conditions as indicated by the control chart provide the justification for investigating the process to discover whether assignable causes are present and can be removed. Note that there is always a possibility of false positives: Assuming observations are normally distributed, one expects Rule 1 to be triggered by chance one out of every 370 observations on average. The false alarm rate rises to one out of every 91.75 observations when evaluating all four rules.
Asymmetric control limits
The zone rules presented above apply to control charts with symmetric control limits. The handbook provides additional guidelines for control charts where the control limits are not symmetrical, as for R charts and p-charts.
For
For other control charts based on skewed distributions, the Handbook recommends:
- Finding the probabilities associated with each zone
- Devising tests that should result in the desired sensitivity to the presence of assignable causes
Other unnatural patterns
The Handbook also identifies patterns that require consideration of both the upper and lower halves of the control chart together for identification: