
 | ||
Water retention curve is the relationship between the water content, θ, and the soil water potential, ψ. This curve is characteristic for different types of soil, and is also called the soil moisture characteristic.
Contents
It is used to predict the soil water storage, water supply to the plants (field capacity) and soil aggregate stability. Due to the hysteretic effect of water filling and draining the pores, different wetting and drying curves may be distinguished.
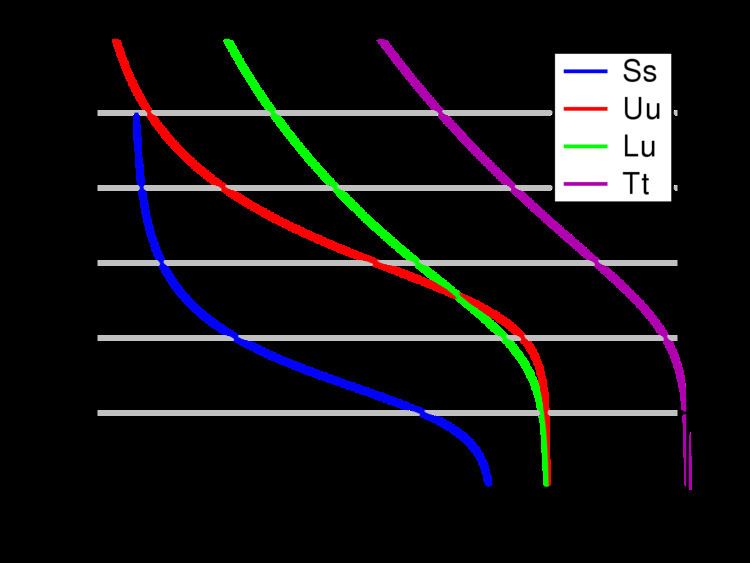
The general features of a water retention curve can be seen in the figure, in which the volume water content, θ, is plotted against the matric potential,
Sandy soils will involve mainly capillary binding, and will therefore release most of the water at higher potentials, while clayey soils, with adhesive and osmotic binding, will release water at lower (more negative) potentials. At any given potential, peaty soils will usually display much higher moisture contents than clayey soils, which would be expected to hold more water than sandy soils. The water holding capacity of any soil is due to the porosity and the nature of the bonding in the soil.
Shape parameters
The shape of water retention curves can be characterized by several models, one of them known as the van Genuchten model:
where
Based on this parametrization a prediction model for the shape of the unsaturated hydraulic conductivity - saturation - pressure relationship was developed.
History
In 1907, Edgar Buckingham created the first water retention curve. It was measured and made for six soils varying in texture from sand to clay. The data came from experiments made on soil columns 48 inch tall, where a constant water level maintained about 2 inches above the bottom through periodic addition of water from a side tube. The upper ends were closed to prevent evaporation.
Method
The van Genuchten parameters (