Harman Patil (Editor)

Timeline of the 2015 Pacific hurricane season

Updated on
Edit
Like
Comment
Share on FacebookTweet on TwitterShare on LinkedInShare on Reddit
Timeline of the 2015 Pacific hurricane season

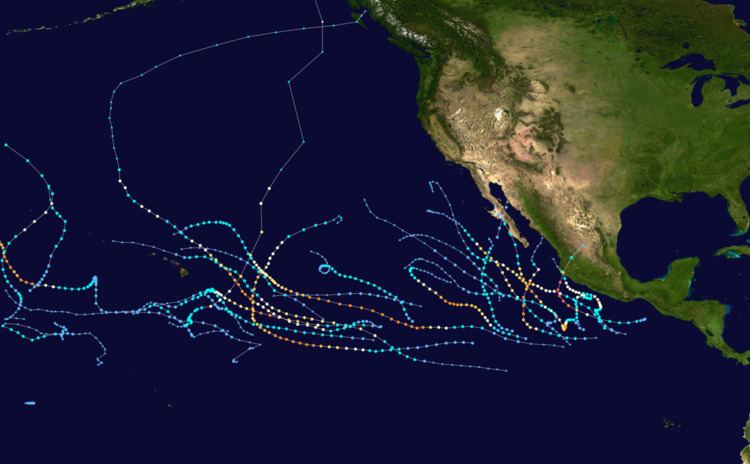
The 2015 Pacific hurricane season was the second-most active year on record, and featured the strongest tropical cyclone ever observed in the Western Hemisphere: Hurricane Patricia. The season officially started on May 15 in the eastern Pacific—east of 140°W—and on June 1 in the central Pacific—between the International Date Line and 140°W—and lasted until November 30. These dates typically cover the period of each year when most tropical cyclones form in the eastern Pacific basin. The season's first storm, Hurricane Andres, developed on May 28; the season's final storm, Hurricane Sandra, degenerated on November 28.

Contents

Throughout the season, 31 tropical depressions developed, 26 of which became tropical storms, a record-tying 16 of them reached hurricane strength, and a record-breaking 11 achieved major hurricane intensity. Of the 11 major hurricanes, a record 9 formed within the Eastern Pacific proper. Activity in the Central Pacific shattered records, with 15 tropical cyclones forming in or entering the basin; the previous highest was 11 during the 1992 and 1994 seasons. On October 23, Hurricane Patricia became the strongest hurricane ever recorded in the Western Hemisphere, with a minimum atmospheric pressure of 872 millibars and maximum sustained winds of 215 mph (345 km/h).

Four time zones are utilized in the basin: Central for storms east of 106°W, Mountain between 114.9°W and 106°W, Pacific between 140°W and 115°W, and Hawaii–Aleutian for storms between the International Date Line and 140°W. However, for convenience, all information is listed by Coordinated Universal Time (UTC) first with the respective local time included in parentheses. This timeline includes information that was not operationally released, meaning that data from post-storm reviews by the National Hurricane Center is included. This timeline documents tropical cyclone formations, strengthening, weakening, landfalls, extratropical transitions, and dissipations during the season.

May

May 15
  • The 2015 Pacific hurricane season officially begins.
  • May 28
  • 06:00 UTC (12:00 a.m. MDT) at 10.8°N 109.9°W / 10.8; -109.9 (Tropical Depression One-E develops) – Tropical Depression One-E develops from an area of disturbed weather about 830 mi (1,335 km) south of the southern tip of the Baja California Peninsula.
  • 12:00 UTC (6:00 a.m. MDT) at 11.1°N 111.0°W / 11.1; -111.0 (Tropical Depression One-E becomes Tropical Storm Andres) – Tropical Depression One-E intensifies into a tropical storm and is named Andres while located 815 mi (1,310 km) south of the southern tip of the Baja California Peninsula.
  • May 29
  • 18:00 UTC (12:00 p.m. MDT) at 12.6°N 114.6°W / 12.6; -114.6 (Tropical Storm Andres intensifies into a hurricane) – Tropical Storm Andres intensifies to a Category 1 hurricane approximately 485 mi (785 km) southwest of Socorro Island.
  • May 30
  • 12:00 UTC (5:00 a.m. PDT) at 14.1°N 115.7°W / 14.1; -115.7 (Hurricane Andres reaches Category 2 status) – Hurricane Andres strengthens into a Category 2 hurricane about 445 mi (715 km) southwest of Socorro Island.
  • May 31
  • 00:00 UTC (5:00 p.m. PDT, May 30) at 15.0°N 116.6°W / 15.0; -116.6 (Hurricane Andres reaches Category 3 status) – Hurricane Andres intensifies to a Category 3 hurricane roughly 450 mi (725 km) southwest of Socorro Island. This marks only the fifth such storm since 1971 to develop during May.
  • 12:00 UTC (7:00 a.m. CDT) at 12.0°N 102.2°W / 12.0; -102.2 (Tropical Depression Two-E develops) – Tropical Depression Two-E develops from an area of disturbed weather approximately 370 mi (595 km) south-southwest of Acapulco, Mexico.
  • June

    June 1
  • 00:00 UTC (5:00 p.m. PDT, May 31) at 15.3°N 119.0°W / 15.3; -119.0 (Hurricane Andres reaches Category 4 status) – Hurricane Andres strengthens into a Category 4 hurricane about 580 mi (935 km) west-southwest of Socorro Island.
  • 06:00 UTC (11:00 p.m. PDT, May 31) at 15.4°N 119.5°W / 15.4; -119.5 (Hurricane Andres reaches its peak intensity) – Hurricane Andres achieves its peak intensity with maximum sustained winds of 145 mph (230 km/h) and a barometric pressure of 937 mbar (hPa; 27.67 inHg) while situated 605 mi (975 km) west-southwest of Socorro Island.
  • 12:00 UTC (7:00 a.m. CDT) at 13.3°N 103.5°W / 13.3; -103.5 (Tropical Depression Two-E becomes Tropical Storm Blanca) – Tropical Depression Two-E intensifies into Tropical Storm Blanca roughly 345 mi (555 km) southwest of Acapulco, Mexico.
  • June 2
  • 00:00 UTC (5:00 p.m. PDT, June 1) at 16.3°N 121.2°W / 16.3; -121.2 (Hurricane Andres weakens to Category 3 status) – Hurricane Andres weakens to a Category 3 hurricane roughly 695 mi (1,120 km) west-southwest of Socorro Island.
  • 06:00 UTC (11:00 p.m. PDT, June 1) at 16.9°N 121.9°W / 16.9; -121.9 (Hurricane Andres weakens to Category 2 status) – Hurricane Andres weakens to a Category 2 hurricane approximately 730 mi (1,175 km) west-southwest of Socorro Island.
  • 12:00 UTC (5:00 a.m. PDT) at 17.4°N 122.7°W / 17.4; -122.7 (Hurricane Andres weakens to Category 1 status) – Hurricane Andres weakens to a Category 1 hurricane about 775 mi (1,245 km) west of Socorro Island.
  • 18:00 UTC (1:00 p.m. CDT) at 12.9°N 104.5°W / 12.9; -104.5 (Tropical Storm Blanca intensifies into a hurricane) – Tropical Storm Blanca intensifies into a Category 1 hurricane roughly 410 mi (605 km) south-southwest of Zihuatanejo, Mexico.
  • June 3
  • 06:00 UTC (11:00 p.m. PDT, June 2) at 18.9°N 124.7°W / 18.9; -124.7 (Hurricane Andres weakens to a tropical storm) – Hurricane Andres weakens to a tropical storm about 895 mi (1,440 km) west of Socorro Island.
  • 06:00 UTC (1:00 a.m. CDT) at 12.6°N 104.6°W / 12.6; -104.6 (Hurricane Blanca reaches Category 2 status) – Hurricane Blanca strengthens into a Category 2 hurricane about 430 mi (695 km) southwest of Acapulco, Mexico.
  • 12:00 UTC (7:00 a.m. CDT) at 12.4°N 104.6°W / 12.4; -104.6 (Hurricane Blanca reaches Category 4 status) – Hurricane Blanca rapidly intensifies to Category 4 intensity about 440 mi (710 km) southwest of Acapulco, Mexico. This marks the earliest occurrence of a season's second major hurricane since reliable records began in 1971.
  • 18:00 UTC (1:00 p.m. CDT) at 12.3°N 104.6°W / 12.3; -104.6 (Hurricane Blanca reaches its peak intensity) – Hurricane Blanca achieves its peak intensity with winds of 145 mph (230 km/h) and a barometric pressure of 936 mbar (hPa; 27.64 inHg) while located about 420 mi (675 km) south-southwest of Lázaro Cárdenas, Mexico.
  • June 4
  • 06:00 UTC (1:00 a.m. CDT) at 12.0°N 104.8°W / 12.0; -104.8 (Hurricane Blanca weakens to Category 3 status) – Tremendous upwelling of cooler waters underneath Hurricane Blanca results in the storm degrading to Category 3 status about 445 mi (715 km) south-southwest of Lázaro Cárdenas, Mexico.
  • 12:00 UTC (5:00 a.m. PDT) at 20.2°N 124.8°W / 20.2; -124.8 (Tropical Storm Andres degenerates into a remnant low) – Tropical Storm Andres degenerates to a remnant low roughly 905 mi (1,455 km) west-northwest of Socorro Island.
  • 12:00 UTC (7:00 a.m. CDT) at 12.2°N 104.9°W / 12.2; -104.9 (Hurricane Blanca weakens to Category 2 status) – Hurricane Blanca rapidly weakens to Category 2 intensity about 435 mi (750 km) south-southwest of Lázaro Cárdenas, Mexico.
  • June 5
  • 12:00 UTC (6:00 p.m. MDT) at 14.5°N 106.5°W / 14.5; -106.5 (Hurricane Blanca weakens to Category 3 status) – Hurricane Blanca further weakens to a Category 1 strength about 345 mi (555 km) southwest of Manzanillo, Mexico.
  • June 6
  • 00:00 UTC (6:00 p.m. MDT, June 5) at 15.7°N 107.9°W / 15.7; -107.9 (Hurricane Blanca regains Category 2 status) – Hurricane Blanca re-intensifies to Category 2 status about 330 mi (530 km) southwest of Manzanillo, Mexico.
  • 06:00 UTC (12:00 a.m. MDT) at 16.4°N 108.5°W / 16.4; -108.5 (Hurricane Blanca regains Category 3 status) – Hurricane Blanca regains Category 3 intensity about 365 mi (585 km) southwest of Puerto Vallarta, Mexico.
  • 12:00 UTC (6:00 a.m. MDT) at 17.1°N 109.1°W / 17.1; -109.1 (Hurricane Blanca regains to Category 4 status) – Hurricane Blanca reaches its secondary peak as a Category 4 with winds of 130 mph (215 km/h) about 355 mi (570 km) southwest of Puerto Vallarta, Mexico.
  • 18:00 UTC (12:00 p.m. MDT) at 17.8°N 109.7°W / 17.8; -109.7 (Hurricane Blanca weakens to Category 3 status) – Hurricane Blanca weakens back to Category 3 status about 350 mi (565 km) southwest of Puerto Vallarta, Mexico.
  • June 7
  • Around 03:30 UTC (9:30 p.m. MDT, June 6) – Hurricane Blanca makes its closest approach to Socorro Island, passing roughly 30 mi (45 km) to the northeast. An automated weather station there recorded sustained winds of 74 mph (119 km/h), with a peak gust of 101 mph (163 km/h), before it ceased reporting.
  • 06:00 UTC (12:00 a.m. MDT) at 19.4°N 110.5°W / 19.4; -110.5 (Hurricane Blanca weakens to Category 2 status) – Hurricane Blanca weakens to a Category 2 hurricane again about 245 mi (395 km) south-southwest of Cabo San Lucas, Mexico.
  • 18:00 UTC (12:00 p.m. MDT) at 20.8°N 110.9°W / 20.8; -110.9 (Hurricane Blanca weakens to a tropical storm) – Hurricane Blanca degrades to a tropical storm about 160 mi (255 km) south-southwest of Cabo San Lucas, Mexico.
  • June 8
  • 10:00 UTC (4:00 a.m. MDT) at 24.3°N 111.7°W / 24.3; -111.7 (Tropical Storm Blanca makes landfall over Isla Santa Margarita, Mexico) – Tropical Storm Blanca makes landfall over Isla Santa Margarita, Mexico, with winds of 50 mph (85 km/h). This marks the earliest instance of a tropical cyclone making landfall along the Baja California Peninsula since reliable records began in 1971, and occurred a month earlier than the previous record.
  • 11:15 UTC (5:15 a.m. MDT) at 24.5°N 111.8°W / 24.5; -111.8 (Tropical Storm Blanca makes landfall near Puerto Argudin, Mexico) – Tropical Storm Blanca traverses Magdalena Bay and makes a second landfall along the Baja California Peninsula, this time near Puerto Argudin with winds of 45 mph (75 km/h).
  • 20:00 UTC (2:00 p.m. MDT) at 26.6°N 113.0°W / 26.6; -113.0 (Tropical Depression Blanca makes landfall near El Patrocinio, Mexico) – Tropical Storm Blanca briefly emerges back over the Pacific Ocean, weakening to a tropical depression in the process. It subsequently makes its third and final landfall about 15 mi (25 km) south-southwest of El Patrocinio, Mexico, with winds of 35 mph (55 km/h).
  • June 9
  • 06:00 UTC (12:00 a.m. MDT) at 28.5°N 114.0°W / 28.5; -114.0 (Tropical Depression Blanca degenerates into a remnant low) – Tropical Depression Blanca degenerates to a non-convective remnant low about 135 mi (215 km) northwest of Santa Rosalía, Mexico.
  • June 10
  • 18:00 UTC (1:00 p.m. CDT) at 12.0°N 98.5°W / 12.0; -98.5 (Tropical Depression Three-E develops) – Tropical Depression Three-E develops from a large area of low pressure approximately 290 mi (465 km) south-southwest of Puerto Escondido, Mexico.
  • June 11
  • 12:00 UTC (7:00 a.m. CDT) at 13.7°N 100.1°W / 13.7; -100.1 (Tropical Depression Three-E becomes Tropical Storm Carlos) – Tropical Depression Three-E intensifies into Tropical Storm Carlos about 230 mi (370 km) south of Acapulco, Mexico.
  • June 13
  • 12:00 UTC (7:00 a.m. CDT) at 15.0°N 99.9°W / 15.0; -99.9 (Tropical Storm Carlos intensifies into a hurricane) – Tropical Storm Carlos intensifies into a Category 1 hurricane about 145 mi (235 km) south of Acapulco, Mexico.
  • 18:00 UTC (1:00 p.m. CDT) at 15.1°N 99.9°W / 15.1; -99.9 (Hurricane Carlos attains its lowest pressure) – Hurricane Carlos attains its lowest barometric pressure of 978 mbar (hPa; 28.88 inHg) approximately 120 mi (195 km) south of Acapulco, Mexico.
  • June 15
  • 00:00 UTC (7:00 p.m. CDT, June 14) at 16.6°N 101.2°W / 16.6; -101.2 (Hurricane Carlos weakens to a tropical storm) – Hurricane Carlos degrades into a tropical storm, possibly due to upwelling of cooler waters from its slow motion, while situated 75 mi (120 km) west-southwest of Acapulco, Mexico.
  • 18:00 UTC (1:00 p.m. CDT) at 16.9°N 102.8°W / 16.9; -102.8 (Tropical Storm Carlos regains hurricane status) – Tropical Storm Carlos regains hurricane status about 85 mi (140 km) southwest of Lazaro Cardenas, Mexico.
  • June 16
  • 18:00 UTC (1:00 p.m. CDT) at 17.7°N 104.3°W / 17.7; -104.3 (Hurricane Carlos attains its maximum winds) – The unusually small Hurricane Carlos, with a 45 mi (72 km) radius of maximum winds, attains its peak winds of 90 mph (150 km/h) roughly 90 mi (150 km) south of Manzanillo, Mexico.
  • June 17
  • 06:00 UTC (1:00 a.m. CDT) at 18.8°N 104.7°W / 18.8; -104.7 (Hurricane Carlos weakens to a tropical storm) – Hurricane Carlos quickly to a tropical storm about 30 mi (50 km) southwest of Manzanillo, Mexico.
  • 09:00 UTC (4:00 a.m. CDT) at 19.3°N 104.9°W / 19.3; -104.9 (Tropical Storm Carlos makes landfall near Tenacatita, Mexico) – Tropical Storm Carlos makes landfall near Tenacatita, Mexico, with winds of 50 mph (85 km/h).
  • 18:00 UTC (12:00 p.m. MDT) at 20.4°N 105.7°W / 20.4; -105.7 (Tropical Storm Carlos degenerates into a remnant low) – Tropical Storm Carlos degenerates into a remnant low, with winds falling below gale-force, approximately 35 mi (55 km) southwest of Puerto Vallarta, Mexico.
  • July

    July 8
  • 03:00 UTC (5:00 p.m. HST, July 7) at 15.4°N 140.2°W / 15.4; -140.2 (Tropical Depression Four-E develops) – Tropical Depression Four-E forms about 1,025 miles (1,650 km) east-southeast of Hilo, Hawaii, quickly crossing west of 140°W and entering the Central Pacific basin.
  • July 9
  • 09:00 UTC (11:00 p.m. HST, July 8) at 19.3°N 145.1°W / 19.3; -145.1 (Tropical Depression Four-E becomes Tropical Storm Ela) – Tropical Depression Four-E intensifies into Tropical Storm Ela about 650 mi (1,050 km) east of Hilo, Hawaii. Ela simultaneously reaches its peak strength with winds of 40 mph (65 km/h) and a pressure of 1004 mbar (hPa; 29.65 inHg).
  • July 10
  • 03:00 UTC (5:00 p.m. HST, July 9) at 21.7°N 147.4°W / 21.7; -147.4 (Tropical Storm Ela weakens to a tropical depression) – Tropical Storm Ela weakens to a tropical depression about 515 mi (830 km) east-northeast of Hilo, Hawaii.
  • 09:00 UTC (11:00 p.m. HST, July 9) at 11.4°N 170.7°W / 11.4; -170.7 (Tropical Depression One-C develops) – Tropical Depression One-C develops from an area of low pressure about 375 mi (605 km) south-southwest of Johnston Island.
  • 09:00 UTC (11:00 p.m. HST, July 9) at 10.9°N 154.5°W / 10.9; -154.5 (Tropical Depression Two-C develops) – Tropical Depression Two-C develops from an area of low pressure about 755 mi (1,210 km) south-southeast of Honolulu, Hawaii.
  • 15:00 UTC (5:00 a.m. HST) at 22.0°N 149.3°W / 22.0; -149.3 (Tropical Depression Ela degenerates into a post-tropical low) – Tropical Depression Ela degenerates into a post-tropical low about 405 mi (655 km) east-northeast of Hilo, Hawaii.
  • July 11
  • 03:00 UTC (5:00 p.m. HST, July 10) at 11.5°N 173.1°W / 11.5; -173.1 (Tropical Depression One-C becomes Tropical Storm Halola) – Tropical Depression One-C strengthens into Tropical Storm Halola about 430 mi (695 km) southwest of Johnston Island.
  • 12:00 UTC (7:00 a.m. CDT) at 11.9°N 98.4°W / 11.9; -98.4 (Tropical Depression Five-E develops) – Tropical Depression Five-E develops from an area of low pressure about 345 mi (555 km) south-southeast of Acapulco, Mexico.
  • 18:00 UTC (1:00 p.m. CDT) at 12.2°N 99.4°W / 12.2; -99.4 (Tropical Depression Five-E becomes Tropical Storm Dolores) – Tropical Depression Five-E intensifies into Tropical Storm Dolores about 325 mi (520 km) south of Acapulco, Mexico.
  • 21:00 UTC (11:00 a.m. HST) at 14.5°N 157.8°W / 14.5; -157.8 (Tropical Depression Two-C becomes Tropical Storm Iune) – Tropical Depression Two-C intensifies into Tropical Storm Iune about 470 mi (755 km) south of Honolulu, Hawaii. Iune simultaneously reaches its peak strength with winds of 40 mph (65 km/h) and a pressure of 1003 mbar (hPa; 29.62 inHg).
  • July 12
  • 09:00 UTC (11:00 p.m. HST, July 11) at 11.5°N 178.0°W / 11.5; -178.0 (Tropical Storm Halola attains its peak strength while within the Central Pacific basin) – Tropical Storm Halola attains winds of 60 mph (95 km/h) and a pressure of 999 mbar (hPa; 29.50 inHg), its maximum strength while within the Central Pacific basin.
  • 12:00 UTC (5:00 a.m. PDT) at 13.1°N 125.0°W / 13.1; -125.0 (Tropical Depression Six-E develops) – Tropical Depression Six-E develops from a broad low approximately 1,195 mi (1,920 km) west-southwest of Cabo San Lucas, Mexico.
  • 21:00 UTC (11:00 a.m. HST) – Tropical Storm Halola crosses the International Date Line (180°), entering the Western Pacific basin, and the Japan Meteorological Agency assumes monitoring responsibilities. Additional advisories are issued by the Joint Typhoon Warning Center and the National Weather Service office in Guam.
  • 21:00 UTC (11:00 a.m. HST) at 14.7°N 161.1°W / 14.7; -161.1 (Tropical Storm Iune weakens to a tropical depression) – Tropical Storm Iune weakens to a tropical depression about 515 mi (830 km) south-southwest of Lihue, Hawaii.
  • July 13
  • 06:00 UTC (11:00 p.m. PDT) at 14.7°N 126.1°W / 14.7; -126.1 (Tropical Depression Six-E becomes Tropical Storm Enrique) – Tropical Depression Six-E strengthens into Tropical Storm Enrique roughly 1,200 mi (1,930 km) southwest of Cabo San Lucas, Mexico.
  • 12:00 UTC (6:00 a.m. MDT) at 16.8°N 105.3°W / 16.8; -105.3 (Tropical Storm Dolores reaches hurricane strength) – Tropical Storm Dolores intensifies into a Category 1 hurricane about 170 mi (270 km) southwest of Manzanillo, Mexico.
  • 15:00 UTC (5:00 a.m. HST) at 14.4°N 164.1°W / 14.4; -164.1 (Tropical Depression Iune degenerates into a post-tropical low) – Tropical Depression Iune degenerates to a post-tropical low about 610 mi (980 km) south-southwest of Lihue, Hawaii.
  • July 14
  • 18:00 UTC (11:00 a.m. PDT) at 17.9°N 130.1°W / 17.9; -130.1 (Tropical Storm Enrique reaches its peak intensity) – Tropical Storm Enrique attains its peak intensity with winds of 50 mph (85 km/h) and a pressure of 1000 mbar (hPa; 29.53 inHg) while situated 1,355 mi (2,180 km) west-southwest of Cabo San Lucas, Mexico.
  • July 15
  • 00:00 UTC (6:00 p.m. MDT, July 14) at 18.0°N 108.9°W / 18.0; -108.9 (Hurricane Dolores reaches Category 2 status) – Hurricane Dolores strengthens to Category 2 intensity about 345 mi (555 km) south of Cabo San Lucas, Mexico.
  • 06:00 UTC (12:00 a.m. MDT) at 18.1°N 109.4°W / 18.1; -109.4 (Hurricane Dolores reaches Category 4 status) – Hurricane Dolores rapidly intensifies into a Category 4 approximately 110 mi (175 km) southeast of Socorro Island. It simultaneously achieves its peak strength with winds of 130 mph (215 km/h) and a pressure of 946 mbar (hPa; 27.94 inHg).
  • 12:00 UTC (6:00 a.m. MDT) at 18.2°N 109.9°W / 18.2; -109.9 (Hurricane Dolores weakens to Category 3 status) – Hurricane Dolores weakens to Category 3 status about 75 mi (120 km) southeast of Socorro Island.
  • July 16
  • 00:00 UTC (6:00 p.m. MDT, July 15) at 18.9°N 110.7°W / 18.9; -110.7 (Hurricane Dolores weakens to Category 2 status) – Hurricane Dolores weakens to Category 2 status as it makes its closest approach to Socorro Island, passing roughly 20 to 25 mi (32 to 40 km) to the northeast. An automated weather station records sustained winds of 79 mph (127 km/h) and a peak gust of 115 mph (185 km/h).
  • July 17
  • 00:00 UTC (6:00 p.m. MDT, July 16) at 20.6°N 112.9°W / 20.6; -112.9 (Hurricane Dolores weakens to Category 1 status) – Hurricane Dolores weakens to Category 1 intensity about 250 mi (400 km) southwest of Cabo San Lucas, Mexico.
  • 12:00 UTC (5:00 a.m. PDT) at 21.2°N 114.6°W / 21.2; -114.6 (Hurricane Dolores weakens to a tropical storm) – Hurricane Dolores weakens into a tropical storm about 325 mi (520 km) west-southwest of Cabo San Lucas, Mexico.
  • 12:00 UTC (5:00 a.m. PDT) at 20.5°N 136.8°W / 20.5; -136.8 (Tropical Storm Enrique weakens to a tropical depression) – Tropical Storm Enrique weakens to a tropical depression roughly 1,190 mi (1,915 km) east-southeast of Hilo, Hawaii.
  • July 18
  • 12:00 UTC (5:00 a.m. PDT) at 20.0°N 137.4°W / 20.0; -137.4 (Tropical Depression Enrique degenerates into a remnant low) – Tropical Depression Enrique degenerates into a remnant low about 1,150 mi (1,850 km) east-southeast of Hilo, Hawaii.
  • 18:00 UTC (11:00 a.m. PDT) at 23.8°N 118.2°W / 23.8; -118.2 (Tropical Storm Dolores degenerates into a remnant low) – Tropical Storm Dolores degenerates into a remnant low approximately 420 mi (675 km) west of Ciudad Constitución, Mexico.
  • July 23
  • 06:00 UTC (12:00 a.m. MDT) at 17.8°N 113.8°W / 17.8; -113.8 (Tropical Depression Seven-E develops) – Tropical Depression Seven-E develops from an elongated area of low pressure about 430 mi (690 km) southwest of Cabo San Lucas, Mexico.
  • 12:00 UTC (6:00 a.m. MDT) at 18.6°N 114.5°W / 18.6; -114.5 (Tropical Depression Seven-E becomes Tropical Storm Felicia) – Tropical Depression Seven-E intensifies into Tropical Storm Felicia roughly 420 mi (675 km) southwest of Cabo San Lucas, Mexico. The system simultaneously attains its peak strength with winds of 40 mph (65 km/h) and a pressure of 1004 mbar (hPa; 29.65 inHg).
  • July 24
  • 00:00 UTC (5:00 p.m. PDT, July 23) at 20.1°N 116.1°W / 20.1; -116.1 (Tropical Storm Felicia weakens to a tropical depression) – Tropical Storm Felicia weakens into a tropical depression about 445 mi (715 km) southwest of Cabo San Lucas, Mexico.
  • 18:00 UTC (11:00 a.m. PDT) at 22.3°N 118.5°W / 22.3; -118.5 (Tropical Depression Felicia degenerates into a remnant low) – Tropical Depression Felicia degenerates into a remnant low about 550 mi (885 km) west-southwest of Cabo San Lucas, Mexico.
  • July 27
  • 18:00 UTC (11:00 a.m. PDT) at 15.4°N 125.2°W / 15.4; -125.2 (Tropical Depression Eight-E develops) – Tropical Depression Eight-E develops from an area of low pressure about 1,115 mi (1,795 km) west-southwest of Cabo San Lucas, Mexico. It simultaneously attains its peak strength with winds of 35 mph (55 km/h) and a pressure of 1006 mbar (hPa; 29.71 inHg).
  • July 29
  • 18:00 UTC (11:00 a.m. PDT) at 7.8°N 123.4°W / 7.8; -123.4 (Tropical Depression Nine-E develops) – Tropical Depression Nine-E develops from an area of low pressure about 1,440 mi (2,315 km) southwest of the southern tip of Baja California.
  • July 30
  • 00:00 UTC (5:00 p.m. PDT, July 29) at 8.0°N 124.7°W / 8.0; -124.7 (Tropical Depression Nine-E becomes Tropical Storm Guillermo) – Tropical Depression Nine-E intensifies into Tropical Storm Guillermo about 1,420 mi (2,285 km) southwest of Cabo San Lucas, Mexico.
  • 00:00 UTC (5:00 p.m. PDT, July 29) at 16.6°N 136.4°W / 16.6; -136.4 (Tropical Depression Eight-E degenerates into a remnant low) – Tropical Depression Eight-E degenerates to a remnant area of low pressure about 1,225 mi (1,970 km) east of the Big Island of Hawaii.
  • July 31
  • 06:00 UTC (11:00 p.m. PDT, July 30) at 11.2°N 130.0°W / 11.2; -130.0 (Tropical Storm Guillermo reaches hurricane strength) – Tropical Storm Guillermo strengthens into a Category 1 hurricane about 1,770 mi (2,850 km) southeast of Hilo, Hawaii.
  • 12:00 UTC (5:00 a.m. PDT) at 12.1°N 131.9°W / 12.1; -131.9 (Hurricane Guillermo reaches Category 2 status) – Hurricane Guillermo attains Category 2 intensity about 1,625 mi (2,615 km) -southeast of Hilo, Hawaii.
  • 18:00 UTC (11:00 a.m. PDT) at 12.5°N 133.9°W / 12.5; -133.9 (Hurricane Guillermo reaches its peak intensity) – Hurricane Guillermo reaches its peak strength with winds of 110 mph (175 km/h) and a pressure of 967 mbar (hPa; 28.56 inHg) while situated 1,490 mi (2,400 km) southeast of Hilo, Hawaii.
  • August

    August 2
  • 00:00 UTC (2:00 p.m. HST, August 1) – Hurricane Guillermo crosses west of 140°W and enters the Central Pacific basin.
  • 18:00 UTC (8:00 a.m. HST) – Hurricane Guillermo weakens to Category 1 intensity about 820 mi (1,320 km) southeast of Hilo, Hawaii.
  • August 3
  • 12:00 UTC (2:00 a.m. HST) – Hurricane Guillermo weakens to a tropical storm approximately 655 mi (1,055 km) east-southeast of Hilo, Hawaii.
  • August 6
  • 00:00 UTC (5:00 p.m. PDT, August 5) – Tropical Depression Ten-E develops from a tropical wave about 1,495 mi (2,405 km) west-southwest of Cabo San Lucas.
  • 12:00 UTC (5:00 a.m. PDT) – Tropical Depression Ten-E strengthens into Tropical Storm Hilda roughly 1,585 mi (2,550 km) west-southwest of Cabo San Lucas, Mexico.
  • August 7
  • 00:00 UTC (2:00 p.m. HST, August 6) – Tropical Storm Guillermo weakens to a tropical depression roughly 130 mi (215 km) north of Hilo, Hawaii.
  • 12:00 UTC (2:00 a.m. HST) – Tropical Depression Guillermo degenerates into a remnant low about 85 mi (140 km) north-northwest of Honolulu, Hawaii.
  • 18:00 UTC (11:00 a.m. PDT) – Tropical Storm Hilda strengthens to a Category 1 hurricane approximately 1,260 mi (2,030 km) southeast of Hilo, Hawaii.
  • August 8
  • 00:00 UTC (5:00 p.m. PDT, August 7) – Hurricane Hilda rapidly intensifies to Category 3 strength about 1,170 mi (1,885 km) southeast of Hilo, Hawaii.
  • 06:00 UTC (8:00 p.m. HST, August 7) – Hurricane Hilda crosses west of 140°W and enters the Central Pacific basin.
  • 18:00 UTC (8:00 p.m. HST) – Hurricane Hilda strengthens to Category 4 intensity about 915 mi (1,475 km) southeast of Hilo, Hawaii. It simultaneously reaches its peak strength with winds of 145 mph (230 km/h) and a pressure of 937 mbar (hPa; 27.67 inHg).
  • August 9
  • 06:00 UTC (8:00 p.m. HST, August 8) – Hurricane Hilda weakens to Category 3 status roughly 760 mi (1,225 km) southeast of Hilo, Hawaii.
  • 18:00 UTC (8:00 a.m. HST) – Hurricane Hilda weakens to Category 2 intensity about 630 mi (1,015 km) southeast of Hilo, Hawaii.
  • August 10
  • 12:00 UTC (2:00 a.m. HST) – Hurricane Hilda weakens to Category 1 intensity about 460 mi (740 km) southeast of Hilo, Hawaii.
  • August 12
  • 00:00 UTC (2:00 p.m. HST, August 11) – Hurricane Hilda weakens to a tropical storm approximately 285 mi (460 km) southeast of Hilo, Hawaii.
  • August 13
  • 18:00 UTC (8:00 a.m. HST) – Tropical Storm Hilda weakens to a tropical depression roughly 230 mi (370 km) south of Hilo, Hawaii.
  • August 14
  • 00:00 UTC (2:00 p.m. HST, August 13) – Tropical Depression Hilda degenerates into a remnant low about 260 mi (420 km) south-southwest of Hilo, Hawaii.
  • August 15
  • 03:00 UTC (5:00 p.m. HST) – Tropical Depression Eleven-E develops from an area of low pressure about 480 mi (775 km) south-southwest of the southern tip of Baja California.
  • August 18
  • 03:00 UTC (5:00 p.m. HST) – Tropical Depression Eleven-E degenerates into a remnant low about 1000 mi (1600 km) west of the southern tip of Baja California.
  • August 20
  • 21:00 UTC (11:00 a.m. HST) at 11.0°N 150.2°W / 11.0; -150.2 (Tropical Depression Three-C develops) – Tropical Depression Three-C develops from an area of low pressure about 685 mi (1100 km) south-southeast of Hilo, Hawaii.
  • August 21
  • 03:00 UTC (5:00 p.m. HST, August 20) at 15.2°N 177.5°W / 15.2; -177.5 (Tropical Depression Four-C develops) – Tropical Depression Four-C develops about 540 mi (870 km) west of Johnston Island.
  • 15:00 UTC (5:00 a.m. HST) at 12.7°N 151.7°W / 12.7; -151.7 (Tropical Depression Three-C becomes Tropical Storm Kilo) – Tropical Depression Three-C strengthens into Tropical Storm Kilo approximately 535 mi (860 km) south-southeast of Hilo, Hawaii.
  • 21:00 UTC (11:00 a.m. HST) at 16.4°N 177.2°W / 16.4; -177.2 (Tropical Depression Four-C becomes Tropical Storm Loke) – Tropical Depression Four-C intensifies to Tropical Storm Loke roughly 510 mi (820 km) west of Johnston Island.
  • August 22
  • 03:00 UTC (5:00 p.m HST, August 21) at 13.4°N 154.9°W / 13.4; -154.9 (Tropical Storm Kilo weakens to a tropical depression) – Tropical Storm Kilo weakens to a tropical depression about 435 mi (700 km) south of Hilo, Hawaii.
  • 15:00 UTC (5:00 a.m. HST) at 17.4°N 177.9°W / 17.4; -177.9 (Tropical Depression Four-C develops) – Tropical Storm Loke weakens to a tropical depression about 555 mi (895 km) west of Johnston Island.
  • August 23
  • 03:00 UTC (5:00 p.m. HST, August 22) at 18.8°N 179.0°W / 18.8; -179.0 (Tropical Storm Loke regains tropical storm status) – Tropical Depression Loke restrengthens into a tropical storm roughly 640 mi (1,030 km) west-northwest of Johnston Island.
  • August 25
  • 00:00 UTC (2:00 p.m. HST, August 24) at 26.3°N 175.3°W / 26.3; -175.3 (Tropical Storm Loke strengthens into a hurricane) – Tropical Storm Loke intensifies into a hurricane, approximately 85 mi (135 km) west-northwest of Lisianski Island, as it moves through the Papahānaumokuākea Marine National Monument.
  • 09:00 UTC (11:00 p.m. HST, August 24) at 28.2°N 174.0°W / 28.2; -174.0 (Hurricane Loke reaches its peak intensity) – Hurricane Loke attains its peak intensity with winds of 75 mph (120 km/h) and a pressure of 985 mbar (hPa; 29.09 inHg) roughly 120 mi (195 km) east-northeast of Pearl and Hermes Atoll.
  • 21:00 UTC (11:00 a.m. HST) at 31.0°N 173.5°W / 31.0; -173.5 (Hurricane Loke weakens to a tropical storm) – Hurricane Loke weakens to a tropical storm about 305 mi (405 km) northeast of Midway Atoll.
  • August 26
  • 21:00 UTC (11:00 a.m. HST) at 18.3°N 167.6°W / 18.3; -167.6 (Tropical Depression Kilo regains tropical storm strength) – After struggling against strong wind shear for nearly five days, Tropical Depression Kilo regains tropical storm strength roughly 165 mi (270 km) northeast of Johnston Island.
  • 21:00 UTC (11:00 a.m. HST) at 38.0°N 179.9°E / 38.0; 179.9 (Tropical Storm Loke crosses the International Dateline and transitions into an extratropical cyclone) – Tropical Storm Loke transitions into an extratropical cyclone as it crosses the International Dateline about 690 mi (1,115 km) north of Midway Atoll.
  • August 29
  • 09:00 UTC (11:00 p.m. HST, August 28) at 17.8°N 173.3°W / 17.8; -173.3 (Tropical Storm Kilo strengthens into a hurricane) – Tropical Storm Kilo intensifies to a hurricane roughly 260 mi (420 km) west-northwest of Johnston Island.
  • 21:00 UTC (11:00 a.m. HST) at 18.0°N 175.5°W / 18.0; -175.5 (Hurricane Kilo reaches Category 3 status) – Hurricane Kilo rapidly intensifies to Category 3 status about 405 mi (655 km) west-northwest of Johnston Island.
  • August 30
  • 03:00 UTC (5:00 p.m. HST, August 29) at 18.4°N 176.2°W / 18.4; -176.2 (Hurricane Kilo reaches Category 3 status) – Hurricane Kilo reaches Category 4 status roughly 455 mi (735 km) west-northwest of Johnston Island.
  • 09:00 UTC (11:00 p.m. HST, August 29) at 18.6°N 176.8°W / 18.6; -176.8 (Hurricane Kilo reaches its peak intensity) – Hurricane Kilo reaches its peak intensity with winds of 140 mph (220 km/h) and a pressure of 940 mbar (hPa; 27.76 inHg) approximately 500 mi (800 km) west-northwest of Johnston Island.
  • 21:00 UTC (11:00 a.m. HST) at 19.4°N 178.1°W / 19.4; -178.1 (Hurricane Kilo weakens to Category 3 status) – Hurricane Kilo weakens to Category 3 status roughly 610 mi (980 km) south of Midway Atoll.
  • August 31
  • 09:00 UTC (11:00 p.m. HST, August 30) at 20.6°N 178.6°W / 20.6; -178.6 (Hurricane Kilo regains Category 4 status) – Hurricane Kilo regains Category 4 strength about 530 mi (855 km) south of Midway Atoll.
  • 18:00 UTC (12:00 p.m. MDT) at 11.8°N 111.7°W / 11.8; -111.7 (Tropical Depression Fourteen-E develops) – Tropical Depression Fourteen-E develops from and elongated area of low pressure about 750 mi (1,205 km) south of Cabo San Lucas, Mexico.
  • September

    September 1
  • 03:00 UTC (5:00 p.m. HST, August 31) at 22.6°N 179.8°W / 22.6; -179.8 (Hurricane Kilo weakens to Category 3 status) – Hurricane Kilo weakens to Category 3 status about 415 mi (665 km) south-southwest of Midway Atoll. Although still east of the International Dateline, the Central Pacific Hurricane Center transfers warning responsibility to the Japan Meteorological Agency and Joint Typhoon Warning Center as Kilo was forecast to cross the boundary later that day.
  • 18:00 UTC (8:00 a.m. HST) at 23.8°N 179.8°E / 23.8; 179.8 (Hurricane Kilo weakens to Category 2 status and crosses the International Dateline) – Hurricane Kilo weakens to Category 2 status as it crosses the International Dateline, exiting the Central Pacific basin, roughly 900 mi (1,450 km) east-northeast of Wake Island.
  • 18:00 UTC (12:00 p.m. MDT) at 13.1°N 113.9°W / 13.1; -113.9 (Tropical Depression Fourteen-E becomes Tropical Storm Kevin) – Tropical Depression Fourteen-E strengthens into Tropical Storm Kevin approximately 725 mi (1,165 km) south-southwest of Cabo San Lucas, Mexico.
  • September 3
  • 18:00 UTC (11:00 a.m. CDT) at 18.5°N 115.8°W / 18.5; -115.8 (Tropical Storm Kevin reaches its peak intensity) – Tropical Storm Kevin reaches its peak intensity with winds of 60 mph (95 km/h) and a pressure of 998 mbar (hPa; 29.47 inHg) roughly 485 mi (780 km) southwest of Cabo San Lucas, Mexico.
  • September 5
  • 06:00 UTC (12:00 a.m. MDT) at 22.8°N 114.6°W / 22.8; -114.6 (Tropical Storm Kevin weakens to a tropical depression) – Tropical Storm Kevin weakens to a tropical depression about 300 mi (485 km) west of Cabo San Lucas, Mexico.
  • 12:00 UTC (6:00 a.m. MDT) at 23.2°N 114.3°W / 23.2; -114.3 (Tropical Depression Kevin degenerates into a remnant low) – Tropical Depression Kevin degenerates into a remnant low roughly 275 mi (445 km) west of Cabo San Lucas, Mexico.
  • 18:00 UTC (12:00 p.m. MDT) at 12.1°N 106.3°W / 12.1; -106.3 (Tropical Depression Fifteen-E develops) – Tropical Depression Fifteen-E develops from a well-defined low approximately 490 mi (790 km) southwest of Manzanillo, Mexico.
  • September 6
  • 06:00 UTC (12:00 a.m. MDT) at 13.2°N 107.8°W / 13.2; -107.8 (Tropical Depression Fifteen-E becomes Tropical Storm Linda) – Tropical Depression Fifteen-E strengthens into Tropical Storm Linda roughly 520 mi (835 km) southwest of Manzanillo, Mexico.
  • September 7
  • 06:00 UTC (12:00 a.m. MDT) at 16.3°N 111.0°W / 16.3; -111.0 (Tropical Storm Linda intensifies into a hurricane) – Tropical Storm Linda reaches Category 1 hurricane status roughly 165 mi (265 km) south of Socorro Island.
  • 12:00 UTC (6:00 a.m. MDT) at 17.2°N 111.7°W / 17.2; -111.7 (Hurricane Linda reaches Category 2 status) – Hurricane Linda strengthens to Category 2 status about 115 mi (185 km) south-southwest of Socorro Island.
  • September 8
  • 12:00 UTC (6:00 a.m. MDT) at 20.6°N 113.6°W / 20.6; -113.6 (Hurricane Linda reaches Category 3 status and its peak strength) – Hurricane Linda intensifies into a Category 3 roughly 210 mi (340 km) northwest of Socorro Island. It simultaneously reaches its peak strength with winds of 125 mph (205 km/h) and a pressure of 950 mbar (hPa; 28.06 inHg).
  • September 9
  • 06:00 UTC (11:00 p.m. PDT, September 8) at 22.8°N 115.9°W / 22.8; -115.9 (Hurricane Linda weakens to Category 2 status) – Hurricane Linda degrades to Category 2 status, entering a rapid weakening phase over cooler waters, approximately 385 mi (620 km) west of Cabo San Lucas, Mexico.
  • 12:00 UTC (5:00 a.m. PDT) at 23.4°N 116.4°W / 23.4; -116.4 (Hurricane Linda weakens to Category 1 status) – Hurricane Linda weakens to a Category 1 roughly 415 mi (670 km) west-northwest of Cabo San Lucas, Mexico.
  • 18:00 UTC (11:00 a.m. PDT) at 24.0°N 117.0°W / 24.0; -117.0 (Hurricane Linda weakens to a tropical storm) – Hurricane Linda weakens to a tropical storm about 455 mi (730 km) west-northwest of Cabo San Lucas, Mexico.
  • September 10
  • 12:00 UTC (5:00 a.m. PDT) at 25.7°N 118.4°W / 25.7; -118.4 (Tropical Storm Linda degenerates into a remnant low) – Tropical Storm Linda degenerates into a non-convective remnant low roughly 570 mi (915 km) northwest of Cabo San Lucas, Mexico.
  • September 18
  • 03:00 UTC (5:00 p.m. HST, September 17) at 18.6°N 174.5°W / 18.6; -174.5 (Tropical Depression Five-C develops) – Tropical Depression Five-C develops roughly 520 mi (835 km) south of Lisianski Island, Hawaii.
  • September 21
  • 12:00 UTC (2:00 a.m. HST) at 24.7°N 171.2°W / 24.7; -171.2 (Tropical Depression Five-C becomes Tropical Storm Malia) – Tropical Depression Five-C strengthens into Tropical Storm Malia about 60 mi (95 km) southwest of Maro Reef, Hawaii.
  • 15:00 UTC (5:00 a.m. HST) at 25.1°N 171.0°W / 25.1; -171.0 (Tropical Storm Malia reaches its peak strength) – Tropical Storm Malia reaches its peak intensity with winds of 40 mph (65 km/h) and a pressure of 1001 mbar (hPa; 29.56 inHg) roughly 35 mi (55 km) west-southwest of Maro Reef, Hawaii.
  • September 22
  • 21:00 UTC (11:00 a.m. HST) at 29.7°N 173.4°W / 29.7; -173.4 (Tropical Storm Malia degenerates into a remnant low) – Tropical Storm Malia degenerates into a remnant low about 250 mi (405 km) north of Lisianski Island, Hawaii.
  • September 25
  • 03:00 UTC (5:00 p.m. HST, September 24) at 14.5°N 149.3°W / 14.5; -149.3 (Tropical Depression Six-C develops) – Tropical Depression Six-C develops roughly 525 mi (845 km) southeast of Hilo, Hawaii.
  • 15:00 UTC (5:00 a.m. HST) at 15.1°N 150.1°W / 15.1; -150.1 (Tropical Depression Six-C becomes Tropical Storm Niala) – Tropical Depression Six-C strengthens into Tropical Storm Niala about 460 mi (735 km) southeast of Hilo, Hawaii.
  • September 26
  • 21:00 UTC (11:00 a.m. HST) at 17.1°N 152.1°W / 17.1; -152.1 (Tropical Storm Niala reaches its peak strength) – Tropical Storm Niala reaches its peak intensity with winds of 65 mph (100 km/h) and a pressure of 992 mbar (hPa; 29.30 inHg) approximately 265 mi (430 km) southeast of Hilo, Hawaii.
  • September 28
  • 15:00 UTC (5:00 a.m. HST) at 15.0°N 156.8°W / 15.0; -156.8 (Tropical Storm Niala weakns to a tropical depression) – Tropical Storm Niala weakens to a tropical depression about 440 mi (710 km) south of Honolulu, Hawaii.
  • September 29
  • 03:00 UTC (5:00 p.m. HST, September 28) at 15.5°N 158.8°W / 15.5; -158.8 (Tropical Depression Niala degenerates into a remnant low) – Tropical Depression Niala degenerates into a remnant low roughly 405 mi (650 km) south of Honolulu, Hawaii.
  • October

    October 3
  • 09:00 UTC (11:00 p.m. HST, October 2) at 13.4°N 154.6°W / 13.4; -154.6 (Tropical Depression Seven-C develops) – Tropical Depression Seven-C develops about 395 mi (635 km) south of Ka Lae, Hawaii. The twelfth tropical cyclone to form in or cross into the Central Pacific during 2015, this marks the highest number of systems in the basin during the satellite era.
  • 15:00 UTC (5:00 a.m. HST) at 14.2°N 154.6°W / 14.2; -154.6 (Tropical Depression Seven-C becomes Tropical Storm Oho) – Tropical Depression Seven-C strengthens into Tropical Storm Oho roughly 340 mi (545 km) south of Ka Lae, Hawaii.
  • 15:00 UTC (5:00 a.m. HST) at 12.0°N 171.4°W / 12.0; -171.4 (Tropical Depression Eight-C develops) – Tropical Depression Eight-C develops roughly 350 mi (460 km) south-southwest of Johnston Island. It simultaneously reaches its peak strength with winds of 35 mph (55 km/h) and a pressure of 1001 mbar (hPa; 29.56 inHg).
  • October 4
  • 15:00 UTC (5:00 a.m. HST) at 10.9°N 171.7°W / 10.9; -171.7 (Tropical Depression Eight-C degenerates into a remnant low) – Tropical Depression Eight-C degenerates into a remnant low about 425 mi (685 km) south-southwest of Johnston Island.
  • October 6
  • 15:00 UTC (5:00 a.m. HST) at 15.3°N 151.3°W / 15.3; -151.3 (Tropical Storm Oho attains hurricane status) – Tropical Storm Oho strengthens into a hurricane roughly 395 mi (635 km) southeast of Hilo, Hawaii.
  • October 7
  • 09:00 UTC (11:00 p.m. HST, October 6) at 20.4°N 147.2°W / 20.4; -147.2 (Hurricane Oho reaches Category 2 status) – Hurricane Oho reaches Category 2 status about 515 mi (830 km) east of Hilo, Hawaii.
  • 15:00 UTC (5:00 a.m. HST) at 23.5°N 145.9°W / 23.5; -145.9 (Hurricane Oho attains its peak intensity) – Hurricane Oho reaches its peak intensity with winds of 110 mph (175 km/h) and a pressure of 957 mbar (hPa; 28.26 inHg) approximately 645 mi (1,040 km) east-northeast of Hilo, Hawaii.
  • October 8
  • 03:00 UTC (5:00 p.m. HST, October 7) at 30.5°N 144.5°W / 30.5; -144.5 (Hurricane Oho weakens to Category 1 status) – Hurricane Oho weakens to Category 1 status about 995 mi (1,605 km) northeast of Hilo, Hawaii.
  • 15:00 UTC (5:00 a.m. HST) at 35.4°N 141.0°W / 35.4; -141.0 (Hurricane Oho transitions into an extratropical cyclone) – Hurricane Oho transitions into an extratropical cyclone, with winds falling below hurricane-force, roughly 1,380 mi (2,225 km) northeast of Hilo, Hawaii.
  • October 9
  • 12:00 UTC (5:00 a.m. PDT) at 10.8°N 131.6°W / 10.8; -131.6 (Tropical Depression Eighteen-E develops) – Tropical Depression Eighteen-E develops from a broad area of low pressure about 1,680 mi (2,705 km) southeast of Hilo, Hawaii.
  • October 10
  • 00:00 UTC (5:00 p.m. PDT, October 9) at 11.1°N 134.5°W / 11.1; -134.5 (Tropical Depression Eighteen-E becomes Tropical Storm Nora) – Tropical Depression Eighteen-E strengthens into Tropical Storm Nora roughly 1,495 mi (2,405 km) southeast of Hilo, Hawaii.
  • October 11
  • 06:00 UTC (8:00 p.m. HST, October 10) – Tropical Storm Nora crosses west of 140°W and enters the Central Pacific basin.
  • October 12
  • 00:00 UTC (2:00 p.m. HST, October 11) at 12.3°N 143.5°W / 12.3; -143.5 (Tropical Storm Nora attains its peak strength) – Tropical Storm Nora reaches its peak intensity with winds of 70 mph (110 km/h) and a pressure of 993 mbar (hPa; 29.33 inHg) about 925 mi (1,490 km) southeast of Hilo, Hawaii.
  • October 14
  • 06:00 UTC (8:00 p.m. HST, October 13) at 14.8°N 150.4°W / 14.8; -150.4 (Tropical Storm Nora weakens to a tropical depression) – Tropical Storm Nora weakens to a tropical depression roughly 460 mi (740 km) southeast of Hilo, Hawaii.
  • October 15
  • 18:00 UTC (8:00 a.m. HST) at 16.6°N 152.7°W / 16.6; -152.7 (Tropical Depression Nora degenerates into a remnant low) – Tropical Depression Nora degenerates into a remnant low about 265 mi (425 km) southeast of Hilo, Hawaii.
  • October 20
  • 06:00 UTC (1:00 a.m. CDT) at 13.4°N 94.0°W / 13.4; -94.0 (Tropical Depression Twenty-E develops) – Tropical Depression Twenty-E develops approximately 205 mi (335 km) south-southeast of Salina Cruz, Mexico.
  • October 21
  • 00:00 UTC (7:00 p.m. CDT, October 20) at 13.1°N 95.1°W / 13.1; -95.1 (Tropical Depression Twenty-E becomes Tropical Storm Patricia) – Tropical Depression Twenty-E strengthens into Tropical Storm Patricia roughly 215 mi (345 km) south of Salina Cruz, Mexico.
  • October 22
  • 06:00 UTC (1:00 a.m. CDT) at 14.0°N 101.7°W / 14.0; -101.7 (Tropical Storm Patricia strengthens into a hurricane) – Tropical Storm Patricia reaches Category 1 hurricane status about 230 mi (370 km) southwest of Acapulco, Mexico.
  • 12:00 UTC (7:00 a.m. CDT) at 14.6°N 103.1°W / 14.6; -103.1 (Hurricane Patricia reaches Category 2 status) – Hurricane Patricia rapidly strengthens to Category 2 status roughly 315 mi (510 km) south of Manzanillo, Mexico.
  • 18:00 UTC (1:00 p.m. CDT) at 15.2°N 104.2°W / 15.2; -104.2 (Hurricane Patricia reaches Category 4 status) – Hurricane Patricia explosively intensifies to Category 4 status roughly 265 mi (425 km) south of Manzanillo, Mexico.
  • October 23
  • 00:00 UTC (7:00 p.m. CDT, October 22) at 15.8°N 104.9°W / 15.8; -104.9 (Hurricane Patricia reaches Category 5 status) – Hurricane Patricia continues to explosively intensify and attains Category 5 status roughly 225 mi (365 km) south-southwest of Manzanillo, Mexico.
  • 12:00 UTC (7:00 a.m. CDT) at 17.3°N 105.6°W / 17.3; -105.6 (Hurricane Patricia attains its peak intensity) – Hurricane Patricia reaches its peak intensity with winds of 215 mph (345 km/h) and a pressure of 872 mbar (hPa; 25.75 inHg) approximately 150 mi (240 km) southwest of Manzanillo, Mexico. This ranks Patricia as the strongest tropical cyclone ever observed in the Western Hemisphere, surpassing Atlantic Hurricane Wilma in 2005 which attained a pressure of 882 mbar (hPa; 26.05 inHg). It is also the second-most intense tropical cyclone on record worldwide, just shy of Typhoon Tip in 1979 which attained a pressure of 870 mbar (hPa; 25.69 inHg).
  • 23:00 UTC (6:00 p.m. CDT) at 19.4°N 105.0°W / 19.4; -105.0 (Hurricane Patricia makes landfall near Cuixmala, Mexico) – Hurricane Patricia rapidly weakens and makes landfall near Cuixmala, Mexico, as a Category 4 hurricane with winds of 150 mph (240 km/h) and a pressure of 932 mbar (hPa; 27.53 inHg). This makes it the strongest landfalling storm on record in the Eastern Pacific.
  • October 24
  • 00:00 UTC (7:00 p.m. CDT, October 23) at 19.6°N 104.9°W / 19.6; -104.9 (Hurricane Patricia weakens to Category 3 status) – Hurricane Patricia weakens to Category 3 status roughly 85 mi (135 km) north-northwest of Manzanillo, Mexico.
  • 03:00 UTC (10:00 p.m. CDT, October 23) at 20.2°N 104.6°W / 20.2; -104.6 (Hurricane Patricia weakens to tropical storm status) – Hurricane Patricia rapidly weakens to a tropical storm about 85 mi (140 km) west-southwest of Guadalajara, Mexico.
  • 12:00 UTC (7:00 a.m. CDT) at 23.2°N 102.3°W / 23.2; -102.3 (Tropical Storm Patricia weakens to a tropical depression) – Tropical Storm Patricia weakens to a tropical depression roughly 90 mi (150 km) north of Aguascalientes City, Mexico.
  • Before 18:00 UTC (1:00 p.m. CDT) – Tropical Depression Patricia dissipates over central Mexico.
  • November

    November 18
  • 12:00 UTC (5:00 a.m. MST) at 12.9°N 106.9°W / 12.9; -106.9 (Tropical Depression Twenty-One-E develops) – Tropical Depression Twenty-One-E forms approximately 455 mi (735 km) south-southwest of Manzanillo, Mexico.
  • November 19
  • 12:00 UTC (5:00 a.m. MST) at 14.2°N 106.1°W / 14.2; -106.1 (Tropical Depression Twenty-One-E becomes Tropical Storm Rick) – Tropical Depression Twenty-One-E strengthens into Tropical Storm Rick about 355 mi (570 km) south-southwest of Manzanillo, Mexico. It simultaneously reaches its peak strength with winds of 40 mph (65 km/h) and a pressure of 1002 mbar (hPa; 29.59 inHg).
  • November 22
  • 06:00 UTC (10:00 p.m. PST, November 21) at 17.0°N 117.5°W / 17.0; -117.5 (Tropical Storm Rick weakens to a tropical depression) – Tropical Storm Rick weakens to a tropical depression roughly 640 mi (1,030 km) southwest of Cabo San Lucas, Mexico.
  • 18:00 UTC (10:00 a.m. PST) at 17.8°N 118.9°W / 17.8; -118.9 (Tropical Depression Rick degenerates to a remnant low) – Tropical Depression Rick degenerates to a remnant low about 675 mi (1,085 km) west-southwest of Cabo San Lucas, Mexico.
  • November 23
  • 18:00 UTC (12:00 p.m. CST) at 10.8°N 102.0°W / 10.8; -102.0 (Tropical Depression Twenty-Two-E develops) – Tropical Depression Twenty-Two-E forms approximately 440 mi (710 km) south-southwest of Acapulco, Mexico.
  • November 24
  • 00:00 UTC (6:00 p.m. CST, November 23) at 10.8°N 103.3°W / 10.8; -103.3 (Tropical Depression Twenty-Two-E becomes Tropical Storm Sandra) – Tropical Depression Twenty-Two-E strengthens into Tropical Storm Sandra about 575 mi (925 km) south of Manzanillo, Mexico.
  • November 25
  • 06:00 UTC (11:00 p.m. MST, November 24) at 12.1°N 108.5°W / 12.1; -108.5 (Tropical Storm Sandra intensifies into a hurricane) – Tropical Storm Sandra strengthens to a Category 1 hurricane approximately 555 mi (895 km) south-southwest of Manzanillo, Mexico.
  • 12:00 UTC (5:00 a.m. MST) at 12.3°N 109.3°W / 12.3; -109.3 (Hurricane Sandra reaches Category 2 status) – Hurricane Sandra rapidly strengthens into a Category 2 hurricane about 570 mi (920 km) southwest of Manzanillo, Mexico.
  • November 26
  • 00:00 UTC (5:00 p.m. MST, November 25) at 13.3°N 110.2°W / 13.3; -110.2 (Hurricane Sandra reaches Category 3 status) – Hurricane Sandra reaches Category 3 status roughly 555 mi (895 km) southwest of Manzanillo, Mexico.
  • 06:00 UTC (11:00 p.m. MST, November 25) at 14.1°N 110.2°W / 14.1; -110.2 (Hurricane Sandra reaches Category 4 status) – Hurricane Sandra rapidly strengthens into a Category 4 hurricane about 530 mi (850 km) southwest of Cabo Corrientes, Mexico. It simultaneously reaches its peak strength with winds of 150 mph (240 km/h) and a pressure of 934 mbar (hPa; 27.58 inHg).
  • November 27
  • 00:00 UTC (5:00 p.m. MST, November 26) at 17.4°N 109.8°W / 17.4; -109.8 (Hurricane Sandra weakens to Category 3 status) – Hurricane Sandra weakens to a Category 3 hurricane roughly 380 mi (610 km) south of the southern tip of the Baja California Peninsula.
  • 06:00 UTC (11:00 p.m. MST, November 26) at 18.5°N 109.3°W / 18.5; -109.3 (Hurricane Sandra rapidly weakens to Category 2 status) – Hurricane Sandra rapidly weakens to a Category 2 hurricane approximately 305 mi (490 km) south of the southern tip of the Baja California Peninsula.
  • 18:00 UTC (11:00 a.m. MST) at 20.0°N 108.2°W / 20.0; -108.2 (Hurricane Sandra weakens to Category 1 status) – Hurricane Sandra weakens to a Category 1 hurricane about 150 mi (245 km) southwest of Islas Marías.
  • November 28
  • 00:00 UTC (5:00 p.m. MST, November 27) at 20.7°N 108.8°W / 20.7; -108.8 (Hurricane Sandra rapidly weakens to a tropical storm) – Hurricane Sandra rapidly weakens to a tropical storm about 160 mi (260 km) west-southwest of Islas Marías.
  • 06:00 UTC (11:00 p.m. MST, November 27) at 21.2°N 109.1°W / 21.2; -109.1 (Tropical Storm Sandra degenerates into a remnant low) – Tropical Storm Sandra degenerates to a remnant low roughly 125 mi (205 km) northeast of Cabo San Lucas, Mexico.
  • November 30
  • The 2015 Pacific hurricane season officially ends.
  • December

    December 31

  • 03:00 UTC (5:00 p.m. HST, December 30) at 2.8°N 177.8°W / 2.8; -177.8 (Tropical Depression Nine-C develops) – Tropical Depression Nine-C develops about 1,115 mi (1,790 km) south-southwest of Johnston Island.
  • References

    Timeline of the 2015 Pacific hurricane season Wikipedia


    Similar Topics