A table of nuclides or chart of nuclides is a two-dimensional graph in which one axis represents the number of neutrons and the other represents the number of protons in an atomic nucleus. Each point plotted on the graph thus represents the nuclide of a real or hypothetical chemical element. This system of ordering nuclides can offer a greater insight into the characteristics of isotopes than the better-known periodic table, which shows only elements instead of each of their isotopes.
Description and utility
A chart or table of nuclides is a simple map to the nuclear, or radioactive, behaviour of nuclides, as it distinguishes the isotopes of an element. It contrasts with a periodic table, which only maps their chemical behavior, since isotopes of the same element do not differ chemically. Nuclide charts organize isotopes along the X axis by their numbers of neutrons and along the Y axis by their numbers of protons, out to the limits of the neutron and proton drip lines. This representation was first published by Giorgio Fea in 1935, and expanded by Emilio Segrè in 1945 or G. Seaborg. In 1958, Walter Seelmann-Eggebert and Gerda Pfennig published the first edition of the Karlsruhe Nuclide Chart. Its 7th edition was made available in 2006. Today, one finds several nuclide charts, four of them have a wide distribution: the Karlsruhe Nuclide Chart, the Strasbourg Universal Nuclide Chart, the Chart of the Nuclides from the JAEA and the Nuclide Chart from Knolls Atomic Power Laboratory. It has become a basic tool of the nuclear community.
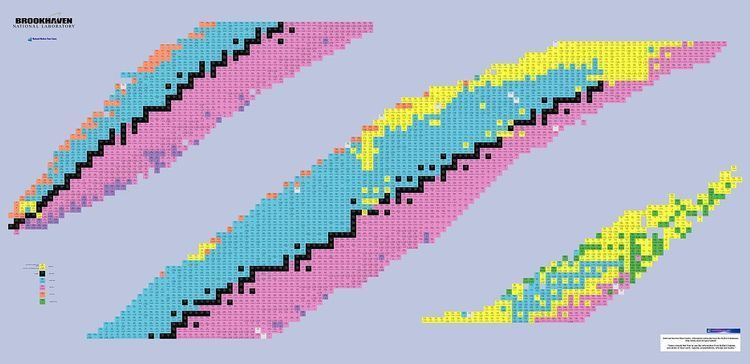
The isotope table below shows isotopes of the chemical elements, including all with half-life of at least one day. They are arranged with increasing atomic numbers from left to right and increasing neutron numbers from top to bottom.
Cell colour denotes the half-life of each isotope; if a border is present, its colour indicates the half-life of the most stable nuclear isomer. In graphical browsers, each isotope also has a tool tip indicating its half-life. Each color represents certain range of length of half-life, and the color of border indicates the half-life of its nuclear isomer state. Some nuclides have multiple nuclear isomers, and this table notes the longest one. Dotted borders mean it has a nuclear isomer, and it's color is same as the normal counterpart.
Isotopes are nuclides with the same number of protons but differing numbers of neutrons; that is, they have the same atomic number and are therefore the same chemical element. Isotopes neighbor each other vertically, e.g., carbon-12, carbon-13, carbon-14 or oxygen-15, oxygen-16, oxygen-17.Isotones are nuclides with the same number of neutrons but differing number of protons. Isotones neighbor each other horizontally. Example: carbon-14, nitrogen-15, oxygen-16 in the sample table above.Isobars are nuclides with the same number of nucleons, i.e. mass number, but different numbers of protons and different number of neutrons. Isobars neighbor each other diagonally from lower-left to upper-right. Example: carbon-14, nitrogen-14, oxygen-14 in the sample table above.Isodiaphers are nuclides with the same difference between neutrons and protons (N−Z). Like isobars, they follow diagonal lines, but at right angles to the isobar lines; from upper-left to lower right. Examples: boron-10, carbon-12, nitrogen-14 where N−Z=0; boron-12, carbon-14, nitrogen-16 where N−Z=2.Beyond the neutron drip line along the right, nuclides decay by neutron emission.Beyond the proton drip line along the upper left, nuclides decay by proton emission. Drip lines have only been established for some elements.The island of stability is a hypothetical region of the table of nuclides that contains isotopes far more stable than other transuranic elements.There are no stable atoms having an equal number of protons and neutrons in their nuclei with atomic number greater than 20 (i.e. calcium) as can be readily "read" from the chart. Nuclei of greater atomic number require an excess of neutrons for stability.The only stable atoms having an odd number of protons and an odd number of neutrons are hydrogen-2, lithium-6, boron-10, nitrogen-14 and (observationally) tantalum-180m. This is because the mass-energy of such atoms is usually higher than that of their neighbors on the same isobar, so most of them are unstable to beta decay.There are no stable atoms with mass numbers 5 or 8. There are stable atoms with all other mass numbers up to 208 with the exceptions of 147 and 151. (Bismuth-209 was found to be radioactive in 2003, but with a half-life of 1.9×10¹⁹ years.)With the possible exception of the pair tellurium-123 and antimony-123, odd mass numbers are never represented by more than one stable atom. This is because the mass-energy is a convex function of atomic number, so all nuclides on an odd isobar except one have a lower-energy neighbor to which they can decay by beta decay.There are no stable atoms having atomic number greater than Z=82 (lead), although bismuth (Z=83) is stable for all practical human purposes. Atoms with atomic numbers from 1 to 82 all have stable isotopes, with the exceptions of technetium (Z=43) and promethium (Z=61).