
 | ||
A synchronoptic view is a graphic display of a number of entities as they proceed through time. A synchronoptic view can be used for many purposes but is best suited to the visual display of history. A number of related timelines can be drawn on a single chart showing which events and lives are contemporary and which are unconnected.
Contents
A synchronoptic view has important educational advantages. Visible information is much more easily learned, than when it is presented only in pure text form. History is an ideal subject for a synchronoptic view. Multiple timelines are able to show how events interacted. Multiple lifelines can show which people were contemporaries. (See example)
A combination of maps is also synchronoptic when it displays successive moments in time.
Etymology
The concept in question is made visual — hence optic. The elements are displayed synchronously: i.e. which events in one area happened at the same time as events in another seemingly unrelated area. Thus synchron-optic.
Synchronoptic also means visible at the same time", or "with parallel views". i.e. The user gets a view of all the information in one go.
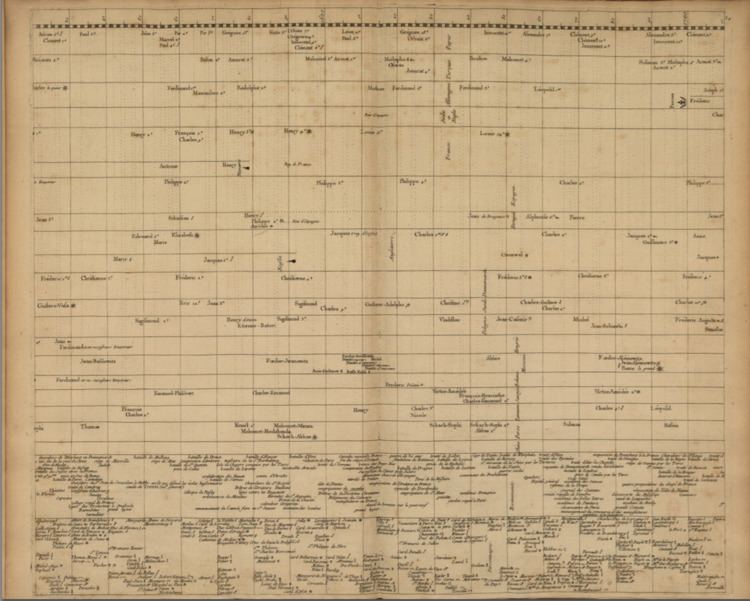
Carte chronographique
Jacques Barbeu-Dubourg (1709–1779) was the first to develop a synchronoptical visualisation with his Chronographie universelle & details qui en dependent pour la Chronologie & les Genealogies (1753) abbreviated to Carte chronographique. The chronographic chart consisted of 35 prints which were designed to be stuck together in a row, enabling 6,500 years to be represented in 6.5 meters. The horizontal axis representing the passage of time was consistent throughout, but the vertical axis was varied depending on the categories Barbeu-Dubourg considered relevant for that period of history.