
 | ||
Sunspots are temporary phenomena on the photosphere of the Sun that appear as dark spots compared to surrounding regions. They are areas of reduced surface temperature caused by concentrations of magnetic field flux that inhibit convection. Sunspots usually appear in pairs of opposite magnetic polarity. Their number varies according to the approximately 11-year solar cycle.
Contents
Individual sunspots may endure anywhere from a few days to a few months, but eventually decay. Sunspots expand and contract as they move across the surface of the Sun with sizes ranging from 16 kilometers (10 mi) to 160,000 kilometers (100,000 mi) in diameter. The larger variety are visible from Earth without the aid of a telescope. They may travel at relative speeds, or proper motions of a few hundred meters per second when they first emerge.
Indicating intense magnetic activity, sunspots accompany secondary phenomena such as coronal loops (prominences) and reconnection events. Most solar flares and coronal mass ejections originate in magnetically active regions around visible sunspot groupings. Similar phenomena indirectly observed on stars other than the sun are commonly called starspots and both light and dark spots have been measured.
Physics
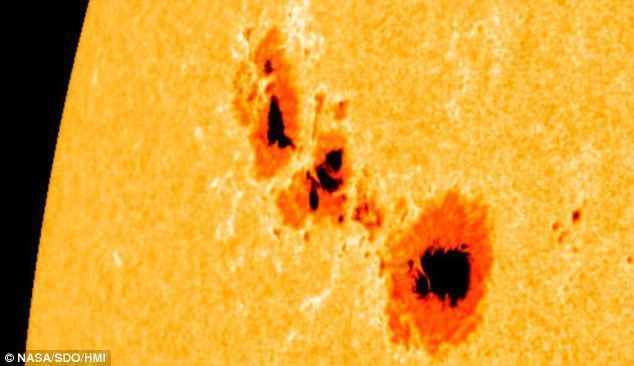
Although they are at temperatures of roughly 3,000–4,500 K (2,700–4,200 °C), the contrast with the surrounding material at about 5,780 K (5,500 °C) leaves sunspots clearly visible as dark spots. This is because the luminance (which is essentially "brightness" in visible light) of a heated black body (closely approximated by the photosphere) at these temperatures varies extremely with temperature—considerably more so than the (temperature to the fourth power) variation in the total black-body radiation at all wavelengths (see Stefan–Boltzmann law). Isolated from the surrounding photosphere a sunspot would be brighter than the Moon.
Sunspots have two parts: the central umbra, which is the darkest part, where the magnetic field is approximately vertical (normal to the Sun's surface) and the surrounding penumbra, which is lighter, where the magnetic field is more inclined.
Lifecycle
Although the details of sunspot generation are still a matter of research, it appears that sunspots are the visible counterparts of magnetic flux tubes in the Sun's convective zone that get "wound up" by differential rotation. If the stress on the tubes reaches a certain limit, they curl up and puncture the Sun's surface. Convection is inhibited at the puncture points; the energy flux from the Sun's interior decreases; and with it surface temperature.
The Wilson effect implies that sunspots are depressions on the Sun's surface. Observations using the Zeeman effect show that prototypical sunspots come in pairs with opposite magnetic polarity. From cycle to cycle, the polarities of leading and trailing (with respect to the solar rotation) sunspots change from north/south to south/north and back. Sunspots usually appear in groups.
Magnetic pressure should tend to remove field concentrations, causing the sunspots to disperse, but sunspot lifetimes are measured in days to weeks. In 2001, observations from the Solar and Heliospheric Observatory (SOHO) using sound waves traveling below the photosphere (local helioseismology) were used to develop a three-dimensional image of the internal structure below sunspots; these observations show that a powerful downdraft underneath each sunspot, forms a rotating vortex that sustains the concentrated magnetic field.
Period
Sunspot activity cycles about every eleven years. The point of highest sunspot activity during a cycle is known as solar maximum, and the point of lowest activity as solar minimum. This period is also observed in most other solar activity and is linked to a variation in the solar magnetic field that changes polarity with this period.
Early in the cycle, sunspots appear in the higher latitudes and then move towards the equator as the cycle approaches maximum, following Spörer's law. Spots from two adjacent cycles can co-exist for some time. Spots from adjacent cycles can be distinguished by direction of their magnetic field.
The Wolf number sunspot index counts the average number of sunspots and groups of sunspots during specific intervals. The 11-year solar cycles are numbered sequentially, starting with the observations made in the 1750s.
George Ellery Hale first linked magnetic fields and sunspots in 1908. Hale suggested that the sunspot cycle period is 22 years, covering two periods of increased and decreased sunspot numbers, accompanied by polar reversals of the solar magnetic dipole field. Horace W. Babcock later proposed a qualitative model for the dynamics of the solar outer layers. The Babcock Model explains that magnetic fields cause the behavior described by Spörer's law, as well as other effects, which are twisted by the Sun's rotation.
Solar cycle
Sunspot populations rise quickly and fall more slowly on an irregular cycle of 11 years. Their numbers also change on over long periods. For example, from 1900 to the 1960s, the solar maxima trend of sunspot count was upwards; for the following decades it diminished. However, the Sun was last as active as this period over 8,000 years ago.
Sunspots number is correlated with the intensity of solar radiation over the period since 1979, when satellite measurements became available. The variation caused by the sunspot cycle to solar output is relatively small, on the order of 0.1% of the solar constant (a peak-to-trough range of 1.3 W·m−2 compared to 1366 W·m−2 for the average solar constant).
Modern observation
Sunspots are observed with land-based and Earth-orbiting solar telescopes. These telescopes use filtration and projection techniques for direct observation, in addition to various types of filtered cameras. Specialized tools such as spectroscopes and spectrohelioscopes are used to examine sunspots and sunspot areas. Artificial eclipses allow viewing of the circumference of the Sun as sunspots rotate through the horizon.
Since looking directly at the Sun with the naked eye permanently damages human vision, amateur observation of sunspots is generally conducted using projected images, or directly through protective filters. Small sections of very dark filter glass, such as a #14 welder's glass, are effective. A telescope eyepiece can project the image, without filtration, onto a white screen where it can be viewed indirectly, and even traced, to follow sunspot evolution. Special purpose hydrogen-alpha narrow bandpass filters as well as aluminum coated glass attenuation filters (which have the appearance of mirrors due to their extremely high optical density) on the front of a telescope provide safe observation through the eyepiece.
Application
Due to its link to other kinds of solar activity, sunspot occurrence can be used to help predict space weather, the state of the ionosphere, and hence the conditions of short-wave radio propagation or satellite communications. Solar activity (and the solar cycle) have been implicated in global warming, originally the role of the Maunder Minimum of sunspot occurrence in the Little Ice Age in European winter climate. Sunspots themselves, in terms of the magnitude of their radiant-energy deficit, have a weak effect on terrestrial climate in a direct sense. On longer time scales, such as the solar cycle, other magnetic phenomena (faculae and the chromospheric network) correlate with sunspot occurrence.
Starspot
In 1947, G. E. Kron proposed that starspots were the reason for periodic changes in brightness on red dwarfs. Since the mid-1990s, starspot observations have been made using increasingly powerful techniques yielding more and more detail: photometry showed starspot growth and decay and showed cyclic behavior similar to the Sun's; spectroscopy examined the structure of starspot regions by analyzing variations in spectral line splitting due to the Zeeman Effect; Doppler imaging showed differential rotation of spots for several stars and distributions different from the Sun's; spectral line analysis measured the temperature range of spots and the stellar surfaces. For example, in 1999, Strassmeier reported the largest cool starspot ever seen rotating the giant K0 star XX Triangulum (HD 12545) with a temperature of 3,500 K (3,230 °C), together with a warm spot of 4,800 K (4,530 °C).