Shinken is an open source computer system and network monitoring software application compatible with Nagios. It watches hosts and services, gathers performance data and alerts users when error conditions occur and again when the conditions clear.
Shinken's architecture aims to offer easier load balancing and high availability. The administrator manages a single configuration, the system automatically "cuts" it into parts and dispatches it to worker nodes. It takes its name from this functionality: a Shinken is a Japanese sword.
Shinken was written by Jean Gabès as a proof of concept for a new Nagios architecture. Believing the new implementation was faster and more flexible than the old C code, he proposed it as the new development branch of Nagios 4. This proposal was turned down by the Nagios authors, so Shinken became an independent network monitoring software application compatible with Nagios.
Shinken is designed to run under all operating systems where Python runs. The development environment is under Linux, but also runs well on other Unix variants and Windows. The reactionner process (responsible for sending notifications) can also be run under the Android OS. It is free software, licensed under the terms of the Affero General Public License as published by the Free Software Foundation.
DesignMonitoring system written in PythonDistributed architecture using Pyro remote objectsActive and Passive monitoring methodsMonitoring of network services (SMTP, POP3, HTTP, NNTP, ICMP, SNMP, FTP, SSH)Monitoring of host resources (processor load, disk usage, system logs) on a majority of network operating systems, including Microsoft WindowsUsing agents such as NSClient++, send_nsca, Check MK, Thrift TSCAUsing agents permitting remotely run scripts via Nagios Remote Plugin Executor (An embedded pure-Python implementation is included with Shinken)Using agent-less methods such as SNMP, WMI, scripted SSH or HTTP(SSL)Send check results directly from programs using Apache Thrift (Java, Python, Ruby)Monitoring of systems which have the ability to send collected data via a network to specifically written plugins (Ex. VMWare ESX3/4/5, Collectd)Remote monitoring supported through SSH or SSL encrypted tunnels.Simple plugin design that allows users to easily develop their own service checks depending on needs, by using the tools of choice (shell scripts, C++, Perl, Ruby, Python, PHP, C#, etc.)Ability to calculate KPIs from State and performance data in the Shinken core to create new services and performance dataSystem external interfacesLivestatus compatible API that exposes state, configuration and performance informationExports data to graphing modules (PNP4Nagios, Graphite, and others available)Support for native messaging API of AndroidExport event data to logging systems using syslog and RabbitMQModules can be attached to any Shinken process to extend its capabilities in very efficient waysPerformanceParallelized service and host checks availableAbility to distribute poller processes on multiple serversSupport for implementing easily redundant and load balanced monitoring hostsSupport for multiple redundant external interfacesAbility to route checks to dedicated pollers (processes specialized in executing plugins)Correlation and business intelligenceParent child relationsAbility to define network host hierarchy using "parent" hosts, allowing detection of and distinction between hosts that are down and those that are unreachable1 to 1, 1 to NFree form dependency trees between any service and host1 to 1, 1 to NSupport for integrated business rulesCalculated hosts or services representing the state of a business serviceSupport assigning a business impact to each service, host or business processAbility to show only root problemsAutomatically changes child states to unknown when parent is unavailableOther featuresContact notifications when service or host problems occur and get resolved (via e-mail, pager, SMS, or any user-defined method through plugin system)Ability to define event handlers to be run during service or host events for proactive problem resolutionAbility to redefine the severity of an alert based on regular expression rulesSupport for UTF-8 objects namesSupport for monitoring multiple customers with one administration pointSupport for recurring downtimes through the maintenance_period attributeAdvanced template system with inheritance and overloadingA Shinken installation consists of several processes, each optimized for a specific task.
ArbiterLoads the configuration files and dispatches the host and service objects to the scheduler(s)Watchdog for all other processes and responsible for initiating failovers if an error is detectedCan route check result events from a Receiver to its associated SchedulerArbiter modulesThere is a variety of modules to manipulate configuration dataSchedulerPlans the next run of host and service checksDispatches checks to the poller(s)Calculates state and dependenciesApplies KPI triggersRaises Notifications and dispatches them to the reactionner(s)Updates the retention file (or other retention backends)Sends broks (internal events of any kind) to the broker(s)PollerGets checks from the scheduler, execute plugins or integrated poller modules and send the results to the schedulerPoller modulesNRPE - Executes active data acquisition for Nagios Remote Plugin Executor agentsSNMP - Executes active data acquisition for SNMP enabled agents (In beta stage using PySNMP)CommandPipe - Receives passive status and performance data from check_mk script, will not process commandsReactionnerGets notifications and eventhandlers from the scheduler, executes plugins/scripts and sends the results to the schedulerBrokerHas multiple modules (usually running in their own processes)Gets broks from the scheduler and forwards them to the broker modulesModules decide if they handle a brok depending on a brok's type (log, initial service/host status, check result, begin/end downtime, ...)Modules process the broks in many different ways. Some of the modules are:webui - updates in-memory objects and provides a webserver for the native Shinken GUIlivestatus - updates in-memory objects which can be queried using an API by GUIs like Thruk or Check_MK Multisitegraphite - exports data to a Graphite databasendodb - updates an ndo database (MySQL or Oracle)simple_log - centralize the logs of all the Shinken processesstatus_dat - writes to a status.dat file which can be read by the classic cgi-based GUIReceiver (optional)Receives data passively from local or remote protocolsPassive data reception that is buffered before forwarding to the appropriate Scheduler (or Arbiter for global commands)Allows to set up a "farm" of Receivers to handle a high rate of incoming eventsModules for receiversNSCA - NSCA protocol receiverCollectd - Receive performance data from collectd via the networkCommandPipe - Receive commands, status updates and performance dataTSCA - Apache Thrift interface to send check results using a high rate buffered TCP connection directly from programsWeb Service - A web service that accepts http posts of check results (beta)There can be multiple instances for each type of process, either on a single host or spread over many hosts. Adding more processes automatically distributes the load.
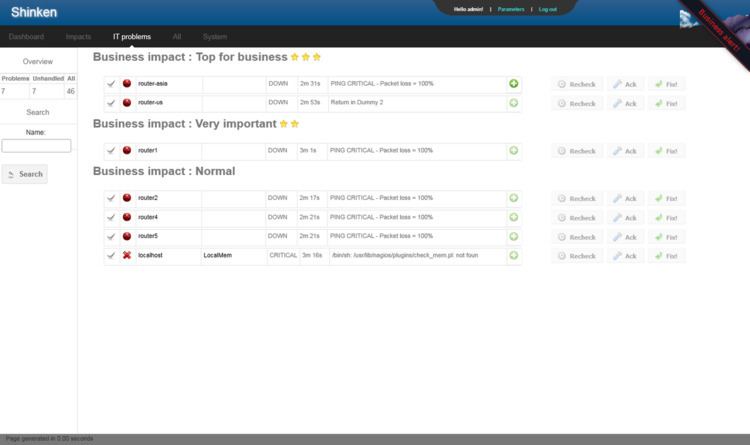
The Shinken WebUI is the builtin Web interface that provides near real time status information, configuration, interaction, a dashboard to visualize trending data from Graphite databases and the visualization of dependency tree graphs.
The Shinken skonfUI is an independent web front-end used to manage the discovery process and configuration tasks.
The shinken-admin CLI script is used to manage during runtime process level aspects of the system, such as changing logging levels and getting health reports.
The install.sh CLI script is the main management script to install, remove or update Shinken and its associated software.
Shinken has an open and test-driven development approach, with contributors to the project providing new features, code refactoring, code quality and bug fixing.
The source code is hosted on GitHub. An integration server runs tests at each commit and in depth tests at regular intervals.
The Shinken documentation is hosted on a wiki.