
Initial release March 14, 1999 Operating system | Written in C | |
 | ||
Original author(s) Stable release 4.2.4 / December 7, 2016; 3 months ago (2016-12-07) | ||
Nagios /ˈnɑːɡiːoʊs/, now known as Nagios Core, is a free and open source computer-software application that monitors systems, networks and infrastructure. Nagios offers monitoring and alerting services for servers, switches, applications and services. It alerts users when things go wrong and alerts them a second time when the problem has been resolved.
Contents
Ethan Galstad and a group of developers originally wrote Nagios as NetSaint. As of 2015 they actively maintain both the official and unofficial plugins. Nagios is a recursive acronym: "Nagios Ain't Gonna Insist On Sainthood" - "sainthood" makes reference to the original name NetSaint, which changed in response to a legal challenge by owners of a similar trademark. "Agios" (or "hagios") also transliterates the Greek word άγιος, which means "saint".
Nagios was originally designed to run under Linux, but it also runs well on other Unix variants. It is free software licensed under the terms of the GNU General Public License version 2 as published by the Free Software Foundation.
Overview
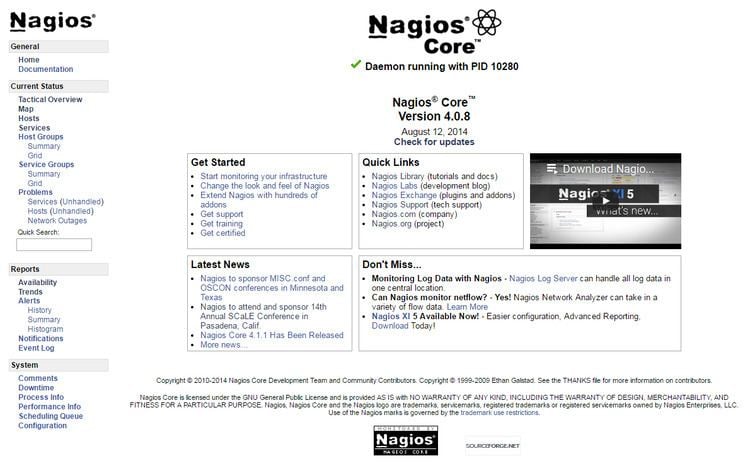
Nagios Core is open source software licensed under the GNU GPL V2.
Currently it provides:
NRPE
Nagios Remote Plugin Executor (NRPE) is a Nagios agent that allows remote system monitoring using scripts that are hosted on the remote systems. It allows for monitoring of resources such as disk usage, system load or the number of users currently logged in. Nagios periodically polls the agent on remote system using the check_nrpe plugin.
NRPE allows you to remotely execute Nagios plugins on other Linux/Unix machines. This allows you to monitor remote machine metrics (disk usage, CPU load, etc.). NRPE can also communicate with some of the Windows agent addons, so you can execute scripts and check metrics on remote Windows machines as well.
NRDP
Nagios Remote Data Processor (NRDP) is a Nagios agent with a flexible data transport mechanism and processor. It is designed with an architecture that allows it to be easily extended and customized. NRDP uses standard ports and protocols (HTTP and XML) and can be implemented as a replacement for Nagios Service Check Acceptor (NSCA).
NSClient++
This program is mainly used to monitor Windows machines. Being installed on a remote system NSClient++ listens to port TCP 12489. The Nagios plugin that is used to collect information from this addon is called check_nt. As NRPE, NSClient++ allows to monitor the so-called 'private services' (memory usage, CPU load, disk usage, running processes, etc.) Nagios is a host and service monitor which is designed to inform your network problems.
NCPA
The Nagios Cross Platform Agent is an open source project maintained by Nagios Enterprises. NCPA installs on Windows, Linux, and Mac OS X. Created as a scale-able API that allows flexibility and simplicity in monitoring hosts. NCPA allows multiple checks such as memory usage, CPU usage, disk usage, processes, services, and network usage. Active checks are queried through the API of the "NCPA Listener" service while passive checks are sent via the "NCPA Passive" service.
Nagios XI
Nagios XI /ˈnɑːɡiːoʊs ɛks aɪ/ is an extended interface, config manager, and toolkit using Nagios Core as the back-end, written and maintained by the original author, Ethan Galstad, and Nagios Enterprises. It is an enterprise-class application that monitors systems, networks and infrastructure. It offers an extensive user interface, configuration editor, advanced reporting, monitoring wizards, an extensible front-end and back-end, along with many other additions over Nagios Core. CentOS and RHEL are the currently supported operating systems. It combines Nagios Core with other technologies. Its main database and the ndoutils module that is used alongside Nagios Core use MySQL. Prior to XI 5, PostgreSQL was used for one of the three databases it uses, and is no longer used on new installs of Nagios XI. While the front-end of Nagios Core is mainly CGI with some PHP, most of the Nagios XI front-end and back-end are written in PHP including the subsystem, event handlers, and notifications, and Python is used to create capacity planning reports and other reports. RRDtool and Highcharts are included to create customizable graphs that can be displayed in dashboards.
2014 controversy over plugins website
On 16 January 2014, Nagios Enterprises redirected the nagios-plugins.org domain to a web server controlled by Nagios Enterprises without explicitly notifying the Nagios Plugins community team the consequences of their actions. Nagios Enterprises replaced the nagios-plugins team with a group of new, different members. The community team members who were replaced continued their work under the name Monitoring Plugins along with a new website with the new domain of monitoring-plugins.org.