
 | ||
Seasonal subseries plots are a graphical tool to visualize and detect seasonality in a time series. Seasonal subseries plots involves the extraction of the seasons from a time series into a subseries. Based on a selected periodicity, it is an alternative plot that emphasizes the seasonal patterns are where the data for each season are collected together in separate mini time plots.
Contents
Seasonal subseries plots enables the underlying seasonal pattern to be seen clearly, and also shows the changes in seasonality over time. Especially, it allows to detect changes between different seasons, changes within a particular season over time.
However, this plot is only useful if the period of the seasonality is already known. In many cases, this will in fact be known. For example, monthly data typically has a period of 12. If the period is not known, an autocorrelation plot or spectral plot can be used to determine it. If there is a large number of observations, then a box plot may be preferable.
Definition
Seasonal sub-series plots are formed by
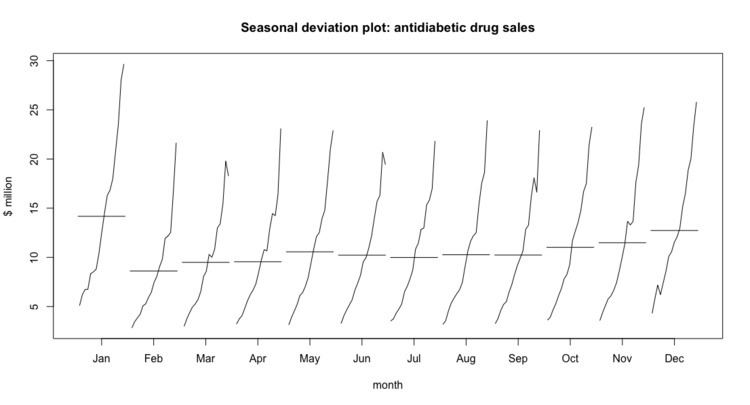
The horizontal line displays the mean value for each month over the time series.
The analyst must specify the length of the seasonal pattern before generating this plot. In most cases, the analyst will know this from the context of the problem and data collection.
Importance
It is important to know when analyzing a time series if there is a significant seasonality effect. The seasonal subseries plot is an excellent tool for determining if there is a seasonal pattern. The seasonal subseries plot can provide answers to the following questions:
Practically, seasonal subseries plots are often inspected as a preliminary screening tool. They allow visual inferences to be drawn from data prior to modelling and forecasting.
Related techniques
Software
Seasonal subseries plots can be implemented in the R programming language using function monthplot().
Example
The following R code results in the above seasonal deviation plot of antidiabetic drug sales;
> monthplot(a10, ylab= "$ million" , xlab= "Month", xaxt= "n", main= "Seasonal deviation plot: antidiabetic drug sales")
> axis(1, at=1:12, labels=month.abb, cex=0.8)