
Elevation 452 m (1,483 ft) Local time Wednesday 6:17 AM Population 469 (31 Dec 2008) | SFOS number 5645 Postal code 1122 | |
 | ||
Weather 6°C, Wind W at 11 km/h, 88% Humidity | ||
Romanel-sur-Morges is a municipality in the canton of Vaud in Switzerland, located in the district of Morges.
Contents
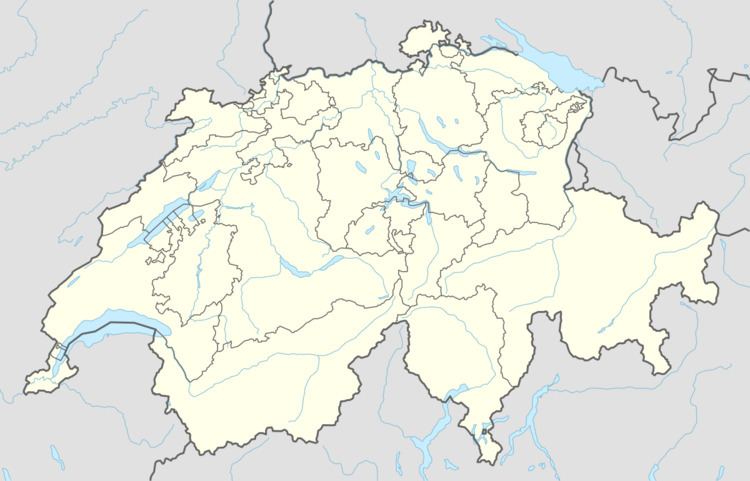
- Map of 1122 Romanel sur Morges Switzerland
- History
- Geography
- Coat of arms
- Demographics
- Politics
- Economy
- Religion
- Education
- References
Map of 1122 Romanel-sur-Morges, Switzerland
History
Romanel-sur-Morges is first mentioned in 967 as villa Romanella.
Geography
Romanel-sur-Morges has an area, as of 2009, of 1.8 square kilometers (0.69 sq mi). Of this area, 1.13 km2 (0.44 sq mi) or 64.6% is used for agricultural purposes, while 0.28 km2 (0.11 sq mi) or 16.0% is forested. Of the rest of the land, 0.28 km2 (0.11 sq mi) or 16.0% is settled (buildings or roads).
Of the built up area, industrial buildings made up 4.0% of the total area while housing and buildings made up 7.4% and transportation infrastructure made up 2.9%. while parks, green belts and sports fields made up 1.1%. Out of the forested land, 14.3% of the total land area is heavily forested and 1.7% is covered with orchards or small clusters of trees. Of the agricultural land, 55.4% is used for growing crops and 3.4% is pastures, while 5.7% is used for orchards or vine crops.
The municipality was part of the Morges District until it was dissolved on 31 August 2006, and Romanel-sur-Morges became part of the new district of Morges.
The municipality is located between Morges and Cossonay on the right bank of the Venoge river.
Coat of arms
The blazon of the municipal coat of arms is Argent, a Chief Gules, overall on a Bend Sable in chief a Corn-ear bendwise Or.
Demographics
Romanel-sur-Morges has a population (as of December 2015) of 458. As of 2008, 9.0% of the population are resident foreign nationals. Over the last 10 years (1999–2009 ) the population has changed at a rate of 13.5%. It has changed at a rate of 6% due to migration and at a rate of 7.5% due to births and deaths.
Most of the population (as of 2000) speaks French (412 or 93.4%), with German being second most common (13 or 2.9%) and Italian being third (5 or 1.1%).
Of the population in the municipality 96 or about 21.8% were born in Romanel-sur-Morges and lived there in 2000. There were 222 or 50.3% who were born in the same canton, while 72 or 16.3% were born somewhere else in Switzerland, and 46 or 10.4% were born outside of Switzerland.
In 2008 there were 2 live births to Swiss citizens and 1 birth to non-Swiss citizens, and in same time span there were 2 deaths of Swiss citizens. Ignoring immigration and emigration, the population of Swiss citizens remained the same while the foreign population increased by 1. There were 5 Swiss men who emigrated from Switzerland. At the same time, there was 1 non-Swiss man who emigrated from Switzerland to another country and 2 non-Swiss women who immigrated from another country to Switzerland. The total Swiss population change in 2008 (from all sources, including moves across municipal borders) was a decrease of 9 and the non-Swiss population increased by 3 people. This represents a population growth rate of -1.3%.
The age distribution, as of 2009, in Romanel-sur-Morges is; 51 children or 10.8% of the population are between 0 and 9 years old and 67 teenagers or 14.2% are between 10 and 19. Of the adult population, 54 people or 11.5% of the population are between 20 and 29 years old. 66 people or 14.0% are between 30 and 39, 78 people or 16.6% are between 40 and 49, and 59 people or 12.5% are between 50 and 59. The senior population distribution is 45 people or 9.6% of the population are between 60 and 69 years old, 34 people or 7.2% are between 70 and 79, there are 16 people or 3.4% who are between 80 and 89, and there is 1 person who is 90 and older.
As of 2000, there were 189 people who were single and never married in the municipality. There were 215 married individuals, 19 widows or widowers and 18 individuals who are divorced.
As of 2000, there were 170 private households in the municipality, and an average of 2.6 persons per household. There were 41 households that consist of only one person and 15 households with five or more people. Out of a total of 171 households that answered this question, 24.0% were households made up of just one person and there were 2 adults who lived with their parents. Of the rest of the households, there are 44 married couples without children, 70 married couples with children There were 11 single parents with a child or children. There were 2 households that were made up of unrelated people and 1 household that was made up of some sort of institution or another collective housing.
In 2000 there were 87 single-family homes (or 71.3% of the total) out of a total of 122 inhabited buildings. There were 17 multi-family buildings (13.9%), along with 11 multi-purpose buildings that were mostly used for housing (9.0%) and 7 other use buildings (commercial or industrial) that also had some housing (5.7%). Of the single-family homes 7 were built before 1919, while 16 were built between 1990 and 2000. The greatest number of single-family homes (33) were built between 1981 and 1990. The most multi-family homes (5) were built between 1971 and 1980 and the next most (4) were built before 1919. There was 1 multi-family house built between 1996 and 2000.
In 2000 there were 173 apartments in the municipality. The most common apartment size was 5 rooms of which there were 43. There were 2 single-room apartments and 78 apartments with five or more rooms. Of these apartments, a total of 162 apartments (93.6% of the total) were permanently occupied, while 10 apartments (5.8%) were seasonally occupied and one apartment was empty. As of 2009, the construction rate of new housing units was 0 new units per 1000 residents. The vacancy rate for the municipality, in 2010, was 1.59%.
The historical population is given in the following chart:
Politics
In the 2007 federal election the most popular party was the FDP which received 25% of the vote. The next three most popular parties were the SVP (17.28%), the SP (13.95%) and the CVP (12.43%). In the federal election, a total of 174 votes were cast, and the voter turnout was 52.4%.
Economy
It is the seat of the European headquarters of Logitech, a major producer of items such as, keyboards, computer mice and speakers.
As of 2010, Romanel-sur-Morges had an unemployment rate of 2.4%. As of 2008, there were 12 people employed in the primary economic sector and about 5 businesses involved in this sector. 120 people were employed in the secondary sector and there were 17 businesses in this sector. 368 people were employed in the tertiary sector, with 34 businesses in this sector. There were 238 residents of the municipality who were employed in some capacity, of which females made up 39.1% of the workforce.
In 2008 the total number of full-time equivalent jobs was 467. The number of jobs in the primary sector was 10, all of which were in agriculture. The number of jobs in the secondary sector was 113 of which 101 or (89.4%) were in manufacturing and 12 (10.6%) were in construction. The number of jobs in the tertiary sector was 344. In the tertiary sector; 205 or 59.6% were in wholesale or retail sales or the repair of motor vehicles, 99 or 28.8% were in the movement and storage of goods, 10 or 2.9% were in a hotel or restaurant, 18 or 5.2% were in the information industry, 5 or 1.5% were technical professionals or scientists, 4 or 1.2% were in education.
In 2000, there were 378 workers who commuted into the municipality and 188 workers who commuted away. The municipality is a net importer of workers, with about 2.0 workers entering the municipality for every one leaving. About 3.4% of the workforce coming into Romanel-sur-Morges are coming from outside Switzerland. Of the working population, 8.4% used public transportation to get to work, and 72.3% used a private car.
Religion
From the 2000 census, 93 or 21.1% were Roman Catholic, while 264 or 59.9% belonged to the Swiss Reformed Church. Of the rest of the population, there were 4 members of an Orthodox church (or about 0.91% of the population), there was 1 individual who belongs to the Christian Catholic Church, and there were 9 individuals (or about 2.04% of the population) who belonged to another Christian church. There were 2 individuals (or about 0.45% of the population) who were Jewish, and 4 (or about 0.91% of the population) who were Islamic. There was 1 individual who belonged to another church. 53 (or about 12.02% of the population) belonged to no church, are agnostic or atheist, and 14 individuals (or about 3.17% of the population) did not answer the question.
Education
In Romanel-sur-Morges about 180 or (40.8%) of the population have completed non-mandatory upper secondary education, and 82 or (18.6%) have completed additional higher education (either university or a Fachhochschule). Of the 82 who completed tertiary schooling, 64.6% were Swiss men, 23.2% were Swiss women, 9.8% were non-Swiss men.
In the 2009/2010 school year there were a total of 70 students in the Romanel-sur-Morges school district. In the Vaud cantonal school system, two years of non-obligatory pre-school are provided by the political districts. During the school year, the political district provided pre-school care for a total of 631 children of which 203 children (32.2%) received subsidized pre-school care. The canton's primary school program requires students to attend for four years. There were 33 students in the municipal primary school program. The obligatory lower secondary school program lasts for six years and there were 37 students in those schools.
As of 2000, there were 24 students in Romanel-sur-Morges who came from another municipality, while 62 residents attended schools outside the municipality.