
 | ||
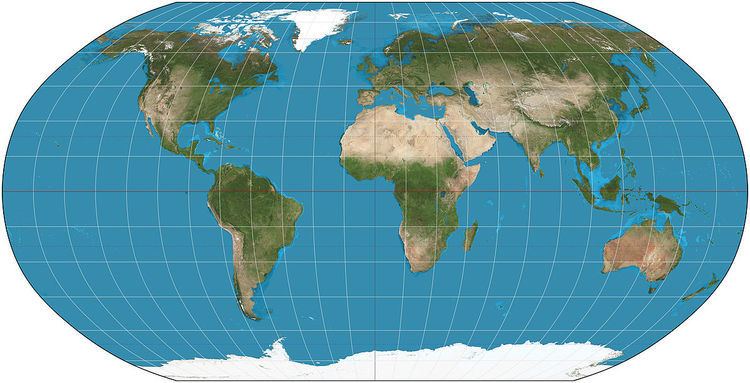
The Robinson projection is a map projection of a world map which shows the entire world at once. It was specifically created in an attempt to find a good compromise to the problem of readily showing the whole globe as a flat image.
Contents
The Robinson projection was devised by Arthur H. Robinson in 1963 in response to an appeal from the Rand McNally company, which has used the projection in general purpose world maps since that time. Robinson published details of the projection's construction in 1974. The National Geographic Society (NGS) began using the Robinson projection for general purpose world maps in 1988, replacing the Van der Grinten projection. In 1998 NGS abandoned the Robinson projection in favor of the Winkel tripel projection for that use as it "reduces the distortion of land masses as they near the poles".
Strengths and weaknesses
The Robinson projection is neither equal-area nor conformal, abandoning both for a compromise. The creator felt this produced a better overall view than could be achieved by adhering to either. The meridians curve gently, avoiding extremes, but thereby stretch the poles into long lines instead of leaving them as points.
Hence, distortion close to the poles is severe, but quickly declines to moderate levels moving away from them. The straight parallels imply severe angular distortion at the high latitudes toward the outer edges of the map, a fault inherent in any pseudocylindrical projection. However, at the time it was developed, the projection effectively met Rand McNally's goal to produce appealing depictions of the entire world.
I decided to go about it backwards. … I started with a kind of artistic approach. I visualized the best-looking shapes and sizes. I worked with the variables until it got to the point where, if I changed one of them, it didn't get any better. Then I figured out the mathematical formula to produce that effect. Most mapmakers start with the mathematics.
Formulation
The projection is defined by the table:
The table is indexed by latitude at 5 degree intervals; intermediate values are calculated using interpolation. Robinson did not specify any particular interpolation method, but it is reported that he used Aitken interpolation himself. The PLEN column is the length of the parallel of latitude, and the PDFE column is multiplied by 0.5072 to obtain the distance of that parallel from the equator. Meridians of longitude are equally spaced on each parallel of latitude.