
 | ||
The risk–return spectrum (also called the risk–return tradeoff or risk–reward) is the relationship between the amount of return gained on an investment and the amount of risk undertaken in that investment. The more return sought, the more risk that must be undertaken.
Contents
- The progression
- Short term loans to good government bodies
- Mid and long term loans to good government bodies
- Short term loans to blue chip corporations
- Mid and long term loans to blue chip corporations
- Rental property
- High yield debt
- Equity
- Options and futures
- Why the progression
- Leverage extends the spectrum
- Domination
- References
The progression
There are various classes of possible investments, each with their own positions on the overall risk-return spectrum. The general progression is: short-term debt; long-term debt; property; high-yield debt; equity. There is considerable overlap of the ranges for each investment class.
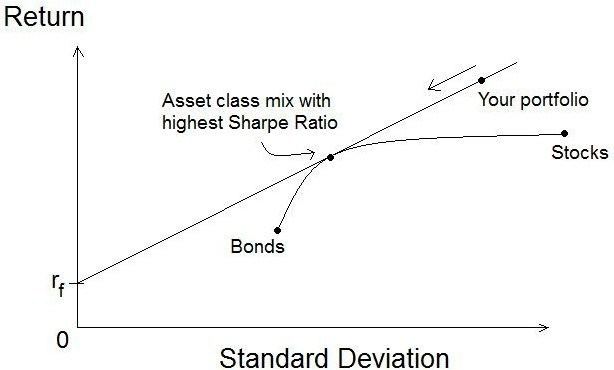
All this can be visualised by plotting expected return on the vertical axis against risk (represented by standard deviation upon that expected return) on the horizontal axis. This line starts at the risk-free rate and rises as risk rises. The line will tend to be straight, and will be straight at equilibrium - see discussion below on domination.
For any particular investment type, the line drawn from the risk-free rate on the vertical axis to the risk-return point for that investment has a slope called the Sharpe ratio.
Short-term loans to good government bodies
On the lowest end is short-dated loans to government and government-guaranteed entities (usually semi-independent government departments). The lowest of all is the risk-free rate of return. The risk-free rate has zero risk (most modern major governments will inflate and monetise their debts rather than default upon them), but the return is positive because there is still both the time-preference and inflation premium components of minimum expected rates of return that must be met or exceeded if the funding is to be forthcoming from providers. The risk-free rate is commonly approximated by the return paid upon 30-day or their equivalent, but in reality that rate has more to do with the monetary policy of that country's central bank than the market supply conditions for credit.
Mid- and long-term loans to good government bodies
The next types of investment is longer-term loans to government, such as 3-year bonds. The range width is larger, and follows the influence of increasing risk premium required as the maturity of that debt grows longer. Nevertheless, because it is debt of good government the highest end of the range is still comparatively low compared to the ranges of other investment types discussed below.
Also, if the government in question is not at the highest jurisdiction (i.e., is a state or municipal government), or the smaller that government is, the more along the risk-return spectrum that government's securities will be.
Short-term loans to blue-chip corporations
Following the lowest-risk investments are short-dated bills of exchange from major blue-chip corporations with the highest credit ratings. The further away from perfect the credit rating, the higher up the risk-return spectrum that particular investment will be.
Mid- and long-term loans to blue-chip corporations
Overlapping the range for short-term debt is the longer term debt from those same well-rated corporations. These are higher up the range because the maturity has increased. The overlap occurs of the mid-term debt of the best rated corporations with the short-term debt of the nearly perfectly, but not perfectly rated corporations.
In this arena, the debts are called investment grade by the rating agencies. The lower the credit rating, the higher the yield and thus the expected return.
Rental property
A commercial property that the investor rents out is comparable in risk or return to a low-investment grade. Industrial property has higher risk and returns, followed by residential (with the possible exception of the investor's own home).
High-yield debt
After the returns upon all classes of investment-grade debt come the returns on speculative-grade high-yield debt (also known derisively as junk bonds). These may come from mid and low rated corporations, and less politically stable governments.
Equity
Equity returns are the profits earned by businesses after interest and tax. Even the equity returns on the highest rated corporations are notably risky. Small-cap stocks are generally riskier than large-cap; companies that primarily service governments, or provide basic consumer goods such as food or utilities, tend to be less volatile than those in other industries. Note that since stocks tend to rise when corporate bonds fall and vice versa, a portfolio containing a small percentage of stocks can be less risky than one containing only debts.
Options and futures
Option and futures contracts often provide leverage on underlying stocks, bonds or commodities; this increases the returns but also the risks. Note that in some cases, derivatives can be used to hedge, decreasing the overall risk of the portfolio due to negative correlation with other investments.
Why the progression?
The existence of risk causes the need to incur a number of expenses. For example, the more risky the investment the more time and effort is usually required to obtain information about it and monitor its progress. For another, the importance of a loss of X amount of value is greater than the importance of a gain of X amount of value, so a riskier investment will attract a higher risk premium even if the forecast return is the same as upon a less risky investment. Risk is therefore something that must be compensated for, and the more risk the more compensation required.
If an investment had a high return with low risk, eventually everyone would want to invest there. That action would drive down the actual rate of return achieved, until it reached the rate of return the market deems commensurate with the level of risk. Similarly, if an investment had a low return with high risk, all the present investors would want to leave that investment, which would then increase the actual return until again it reached the rate of return the market deems commensurate with the level of risk. That part of total returns which sets this appropriate level is called the risk premium.
Leverage extends the spectrum
The use of leverage can extend the progression out even further. Examples of this include borrowing funds to invest in equities, or use of derivatives.
If leverage is used then there are two lines instead of one. This is because although one can invest at the risk-free rate, one can only borrow at an interest rate according to one's own credit-rating. This is visualised by the new line starting at the point of the riskiest unleveraged investment (equities) and rising at a lower slope than the original line. If this new line were traced back to the vertical axis of zero risk, it will cross it at the borrowing rate.
Domination
All investment types compete against each other, even though they are on different positions on the risk-return spectrum. Any of the mid-range investments can have their performances simulated by a portfolio consisting of a risk-free component and the highest-risk component. This principle, called the separation property, is a crucial feature of modern portfolio theory. The line is then called the capital market line.
If at any time there is an investment that has a higher Sharpe ratio than another then that return is said to dominate. When there are two or more investments above the spectrum line, then the one with the highest Sharpe ratio is the most dominant one, even if the risk and return on that particular investment is lower than another. If every mid-range return falls below the spectrum line, this means that the highest-risk investment has the highest Sharpe Ratio and so dominates over all others.
If at any time there is an investment that dominates then funds will tend to be withdrawn from all others and be redirected to that dominating investment. This action will lower the return on that investment and raise it on others. The withdrawal and redirection of capital ceases when all returns are at the levels appropriate for the degrees of risk and commensurate with the opportunity cost arising from competition with the other investment types on the spectrum, which means they all tend to end up having the same Sharpe Ratio.