
 | ||
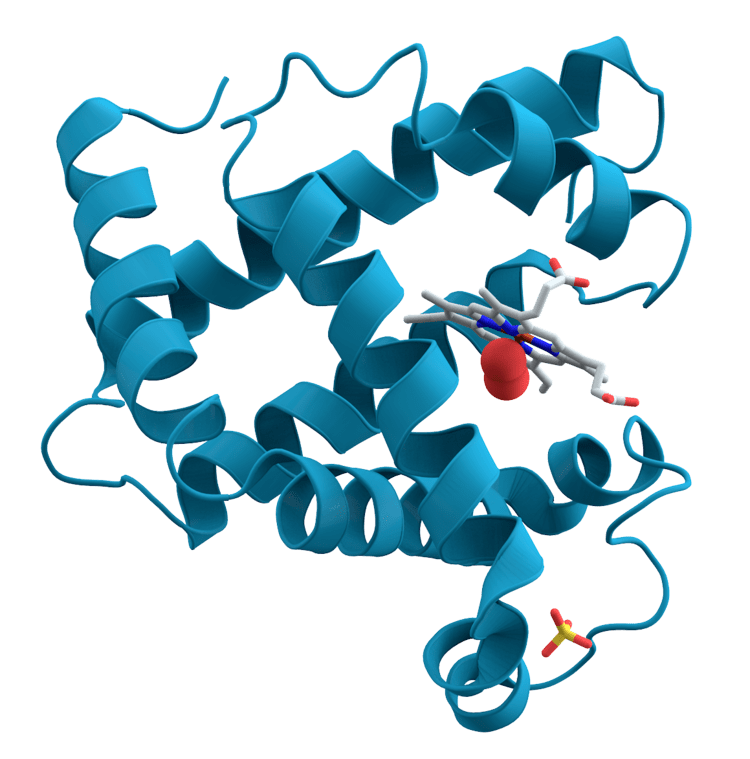
Ribbon diagrams, also known as Richardson Diagrams, are 3D schematic representations of protein structure and are one of the most common methods of protein depiction used today. The ribbon shows the overall path and organization of the protein backbone in 3D, and serves as a visual framework on which to hang details of the full atomic structure, such as the balls for the oxygen atoms bound to the active site of myoglobin in the image at the right. Ribbon diagrams are generated by interpolating a smooth curve through the polypeptide backbone. α-helices are shown as coiled ribbons or thick tubes, β-strands as arrows, and lines or thin tubes for non-repetitive coils or loops. The direction of the polypeptide chain is shown locally by the arrows, and may be indicated overall by a colour ramp along the length of the ribbon.
Contents
Ribbon diagrams are simple, yet powerful, in expressing the visual basics of a molecular structure (twist, fold and unfold). This method has successfully portrayed the overall organization of the protein structure, reflecting its 3-dimensional information, and allowing for better understanding of a complex object both by the expert structural biologists and also by other scientists, students, and the general public.
History
Originally conceived by Jane S. Richardson in 1980 (influenced by earlier individual illustrations), her hand-drawn ribbon diagrams were the first schematics of 3D protein structure to be produced systematically, to illustrate a classification of protein structures for an article in Advances in Protein Chemistry (now available in annotated form on-line at Anatax). These drawings were made in pen on tracing paper over a printout of a Cα trace of the atomic coordinates; they preserved positions, smoothed the backbone path, and incorporated small local shifts to disambiguate the visual appearance. As well as the TIM ribbon drawing at the right, other hand-drawn examples are for prealbumin, flavodoxin, and Cu,Zn superoxide dismutase.
In 1982, Arthur M. Lesk and co-workers first enabled automatic generation of ribbon diagrams through a computational implementation that uses Protein Data Bank files as input. This conceptually simple algorithm fit cubic polynomial B-spline curves to the peptide planes. Most modern graphics systems provide either B-splines or Hermite splines as a basic drawing primitive. One type of spline implementation passes through each Cα guide point, producing an exact but choppy curve. Both hand-drawn and most computer ribbons (such as those shown here) are smoothed over about 4 successive guide points (usually the peptide midpoint), to produce a more visually pleasing and understandable representation. In order to give the right radius for helical spirals while preserving smooth β-strands, the splines can be modified by offsets proportional to local curvature, as first developed by Mike Carson for his Ribbons program (figure at right) and later adapted by other molecular graphics software, such as the open-source Mage program for kinemage graphics that produced the ribbon image at top right (other examples: 1xk8 trimer and DNA polymerase).
Since their inception, and continuing in the present, a ribbon diagram is the single most common representation of protein structures and a very common choice of cover image for a journal or textbook.
Current computer programs
One popular program used for drawing ribbon diagrams is Molscript. Molscript utilizes Hermite splines to create coordinates for coils, turns, strands and helices. The curve passes through all its control points (Cα atoms) guided by direction vectors. The program was built on the basis of traditional molecular graphics by Arthur M. Lesk, Karl Hardman, and John Priestle. Jmol is an open-source Java-based viewer for browsing molecular structures on the web; it includes a simplified "cartoon" version of ribbons. Other graphics programs such as DeepView (example: urease) and MolMol (example: SH2 domain) also produce ribbon images. KiNG is the Java-based successor to Mage (examples: α-hemolysin top view and side view).
UCSF Chimera is a powerful molecular modeling program that also includes visualizations such as ribbons, notable especially for the ability to combine them with contoured shapes from cryo-electron microscopy data. PyMOL, by Warren DeLano, is a very popular and flexible molecular graphics program (based on Python) that operates in interactive mode and also produces presentation-quality 2D images for ribbon diagrams and many other representations.