
 | ||
The price/earnings ratio (often shortened to the P/E ratio or the PER) is the ratio of a company's stock price to the company's earnings per share. The ratio is used in valuing companies.
Contents
Versions
There are multiple versions of the P/E ratio, depending on whether earnings are projected or realized, and the type of earnings.
As an example, if stock A is trading at $24 and the earnings per share for the most recent 12-month period is $3, then stock A has a P/E ratio of 24/3 or 8. Put another way, the purchaser of the stock is investing $8 for every dollar of earnings. Companies with losses (negative earnings) or no profit have an undefined P/E ratio (usually shown as "not applicable" or "N/A"); sometimes, however, a negative P/E ratio may be shown.
Some people mistakenly use the formula market capitalization / net income to calculate the P/E ratio. This formula often gives the same answer as market price / earnings per share, but if new capital has been issued it gives the wrong answer, as market capitalization = market price × current number of shares whereas earnings per share= net income / weighted average number of shares.
Variations on the standard trailing and forward P/E ratios are common. Generally, alternative P/E measures substitute different measures of earnings, such as rolling averages over longer periods of time (to attempt to "smooth" volatile or cyclical earnings, for example), or "corrected" earnings figures that exclude certain extraordinary events or one-off gains or losses. The definitions may not be standardized. For companies that are loss-making, or whose earnings are expected to change dramatically, a "primary" P/E can be used instead, based on the earnings projections made for the next years to which a discount calculation is applied.
Interpretation
The price/earnings ratio (PER) is the most widely used method for determining whether shares are “correctly” valued in relation to one another. But the PER does not in itself indicate whether the share is a bargain. The PER depends on the market’s perception of the risk and future growth in earnings. A company with a low PER indicates that the market perceives it as lower risk or lower growth or both as compared to a company with a higher PER. The PER of a listed company’s share is the result of the collective perception of the market as to how risky the company is and what its earnings growth prospects are in relation to that of other companies. Investors use the PER to compare their own perception of the risk and growth of a company against the market’s collective perception of the risk and growth as reflected in the current PER. If the investor feels that his perception is superior to that of the market, he can make the decision to buy or sell accordingly.
Historical P/E ratios for the U.S. stock market
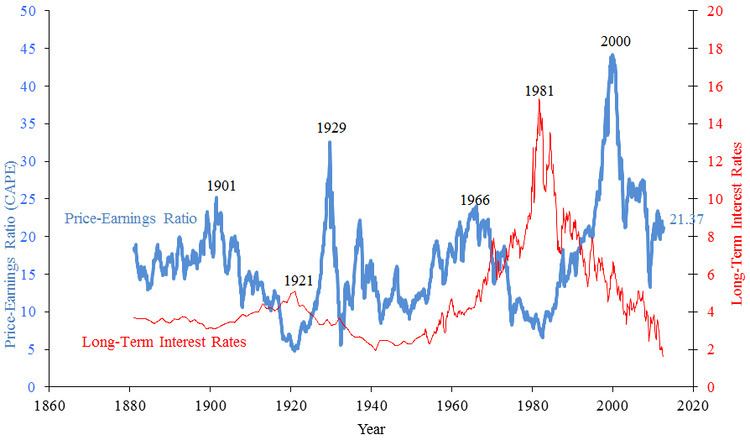
Since 1900, the average P/E ratio for the S&P 500 index has ranged from 4.78 in Dec 1920 to 44.20 in Dec 1999. However, except for some brief periods, during 1920–1990 the market P/E ratio was mostly between 10 and 20.
The average P/E of the market varies in relation with, among other factors, expected growth of earnings, expected stability of earnings, expected inflation, and yields of competing investments. For example, when U.S. treasury bonds yield high returns, investors pay less for a given earnings per share and P/E's fall.
The average U.S. equity P/E ratio from 1900 to 2005 is 14 (or 16, depending on whether the geometric mean or the arithmetic mean, respectively, is used to average).
Jeremy Siegel has suggested that the average P/E ratio of about 15 (or earnings yield of about 6.6%) arises due to the long term returns for stocks of about 6.8%. In Stocks for the Long Run, (2002 edition) he had argued that with favorable developments like the lower capital gains tax rates and transaction costs, P/E ratio in "low twenties" is sustainable, despite being higher than the historic average.
Set out below are the recent year end values of the S&P 500 index and the associated P/E as reported. For a list of recent contractions (recessions) and expansions see U.S. Business Cycle Expansions and Contractions.
Note that at the height of the Dot-com bubble P/E had risen to 32. The collapse in earnings caused P/E to rise to 46.50 in 2001. It has declined to a more sustainable region of 17. Its decline in recent years has been due to higher earnings growth.
The P/E ratio in business culture
The P/E ratio of a company is a major focus for many managers. They are usually paid in company stock or options on their company's stock (a form of payment that is supposed to align the interests of management with the interests of other stock holders). The stock price can increase in one of two ways: either through improved earnings or through an improved multiple that the market assigns to those earnings. In turn, the primary drivers for multiples such as the P/E ratio is through higher and more sustained earnings growth rates.
Consequently, managers have strong incentives to boost earnings per share, even in the short term, and/or improve long term growth rates. This can influence business decisions in several ways: