
 | ||
In mathematics and statistics, the arithmetic mean (/ˌærɪθˈmɛtɪk ˈmiːn/), or simply the mean or average when the context is clear, is the sum of a collection of numbers divided by the number of numbers in the collection. The collection is often a set of results of an experiment, or a set of results from a survey. The term "arithmetic mean" is preferred in some contexts in mathematics and statistics because it helps distinguish it from other means, such as the geometric mean and the harmonic mean.
Contents
- Definition
- Motivating properties
- Contrast with median
- Weighted average
- Continuous probability distributions
- Angles
- References
In addition to mathematics and statistics, the arithmetic mean is used frequently in fields such as economics, sociology, and history, and it is used in almost every academic field to some extent. For example, per capita income is the arithmetic average income of a nation's population.
While the arithmetic mean is often used to report central tendencies, it is not a robust statistic, meaning that it is greatly influenced by outliers (values that are very much larger or smaller than most of the values). Notably, for skewed distributions, such as the distribution of income for which a few people's incomes are substantially greater than most people's, the arithmetic mean may not accord with one's notion of "middle", and robust statistics, such as the median, may be a better description of central tendency.
In a more obscure usage, any sequence of values that form an arithmetic sequence between two numbers x and y can be called "arithmetic means between x and y."
Definition
The arithmetic mean (or mean or average) is the most commonly used and readily understood measure of central tendency. In statistics, the term average refers to any of the measures of central tendency. The arithmetic mean is defined as being equal to the sum of the numerical values of each and every observation divided by the total number of observations. Symbolically, if we have a data set containing the values
(See summation for an explanation of the summation operator).
For example, let us consider the monthly salary of 10 employees of a firm: 2500, 2700, 2400, 2300, 2550, 2650, 2750, 2450, 2600, 2400. The arithmetic mean is
If the data set is a statistical population (i.e., consists of every possible observation and not just a subset of them), then the mean of that population is called the population mean. If the data set is a statistical sample (a subset of the population), we call the statistic resulting from this calculation a sample mean.
The arithmetic mean of a variable is often denoted by a bar, for example as in
Motivating properties
The arithmetic mean has several properties that make it useful, especially as a measure of central tendency. These include:
Contrast with median
The arithmetic mean may be contrasted with the median. The median is defined such that half the values are larger than, and half are smaller than, the median. If elements in the sample data increase arithmetically, when placed in some order, then the median and arithmetic average are equal. For example, consider the data sample
There are applications of this phenomenon in many fields. For example, since the 1980s, the median income in the United States has increased more slowly than the arithmetic average of income.
Weighted average
A weighted average, or weighted mean, is an average in which some data points count more strongly than others, in that they are given more weight in the calculation. For example, the arithmetic mean of
Continuous probability distributions
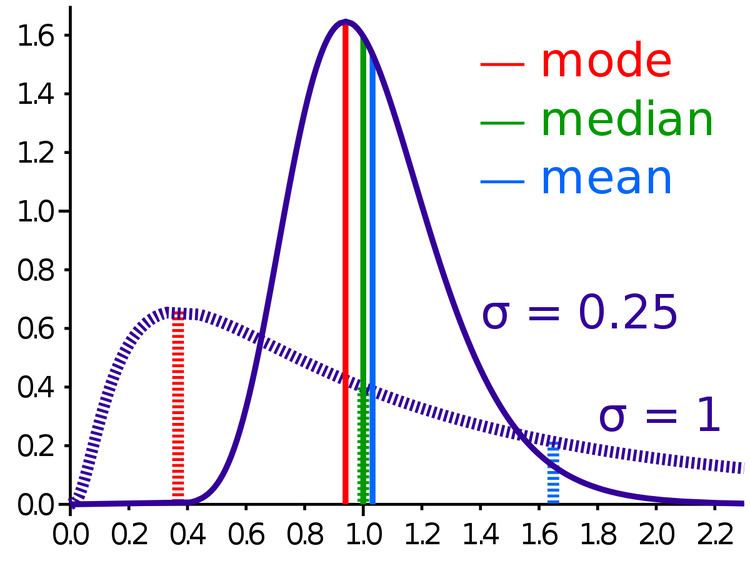
When a population of numbers, and any sample of data from it, could take on any of a continuous range of numbers, instead of for example just integers, then the probability of a number falling into one range of possible values could differ from the probability of falling into a different range of possible values, even if the lengths of both ranges are the same. In such a case, the set of probabilities can be described using a continuous probability distribution. The analog of a weighted average in this context, in which there are an infinitude of possibilities for the precise value of the variable, is called the mean of the probability distribution. The most widely encountered probability distribution is called the normal distribution; it has the property that all measures of its central tendency, including not just the mean but also the aforementioned median and the mode, are equal to each other. This property does not hold however, in the cases of a great many probability distributions, such as the lognormal distribution illustrated here.
Angles
Particular care must be taken when using cyclic data, such as phases or angles. Naïvely taking the arithmetic mean of 1° and 359° yields a result of 180°. This is incorrect for two reasons:
In general application, such an oversight will lead to the average value artificially moving towards the middle of the numerical range. A solution to this problem is to use the optimization formulation (viz., define the mean as the central point: the point about which one has the lowest dispersion), and redefine the difference as a modular distance (i.e., the distance on the circle: so the modular distance between 1° and 359° is 2°, not 358°).