
 | ||
Political party strength in U.S. states refers to the level of representation of the various political parties of the U.S. in each statewide elective office providing legislators to the state and to the U.S. Congress and electing the executives at the state (U.S. state governor) and national (U.S. President) level.
Contents
History
Throughout most of the 20th century, although the Republican and Democratic parties alternated in power at a national level, some states were so overwhelmingly dominated by one party that nomination was usually tantamount to election. This was especially true in the Solid South, where the Democratic Party was dominant for the better part of a century, from the end of Reconstruction in the late 1870s, through the period of Jim Crow Laws into the 1960s. Conversely, the New England states of Vermont, Maine, and New Hampshire were dominated by the Republican Party, as were some Midwestern states like Iowa and North Dakota.
However, in the 1970s and 1980s, the increasingly conservative Republican Party gradually overtook the Democrats in the southeast. The Democrats' support in the formerly Solid South had been eroded during the vast cultural, political and economic upheaval that surrounded the 1960s. By the 1990s the Republican Party had completed the transition into the southeast's dominant political party, despite typically having fewer members due to the prevalence of Republican voting generational Democrats. In New England, the opposite trend took place; the former Republican strongholds of Maine and Vermont became solidly Democratic, as did formerly Republican areas of New Jersey, New York, and Connecticut.
Currently, the majority of the overall number of seats held in the state legislatures has been switching between the two parties every few years. As of the U.S. gubernatorial elections of 2010, the Republican party holds an outright majority of approximately 440 with 3,890 seats (53% of total) compared to the Democratic party's number of 3,450 (47% of total) seats elected on a partisan ballot. Of the 7,382 seats in all of the state legislatures combined, independents and third parties account for only 16 members, not counting the 49 members of the Nebraska Legislature, which is the only legislature in the nation to hold non-partisan elections to determine its members. Due to the results of the 2010 elections, Republicans took control of an additional 19 state legislative chambers, giving them majority control of both chambers in 25 states versus the Democrats' majority control of both chambers in only 16 states, with 8 states having split or inconclusive control of both chambers (not including Nebraska); previous to the 2010 elections, it was Democrats who controlled both chambers in 27 states versus the Republican party having total control in only 14 states, with eight states divided and Nebraska being nonpartisan.
Gallup
As of October 2014, Gallup polling found that 43% of Americans identified as Democrats and 39% as Republicans, when party "leaners" were included; those figures changed to 41% Democratic and 42% Republican after the November 2014 elections. However, an earlier 2013 Gallup survey found that 42% of Americans identified as political independents, a record high.
The latter result is more in line with Gallup polling in 2010 that found that 31% of Americans identified as Democrats (tying a 22-year low), 29% as Republicans, and 38% as independents. Nevertheless, more American independents leaned to the Republican Party when compared to the Democratic Party. Combining leaners with each party's core identifiers, the parties ended up tied at 45 percent in 2011.
In 2014, Gallup found seventeen states safely or leaning Democratic, and fifteen states safely or leaning Republican, with eighteen states categorized as "competitive between the two parties", a net shift of one state to the Republican side since 2013. In February 2016, Gallup found fourteen states safely or leaning Democratic, and twenty states safely or leaning Republican, with sixteen categorized as "competitive", a net Democrat decline of eight states to give the Republicans a six state advantage. This is also the first time in the eight years that Gallup has tracked state partisanship that there have been more Republican than Democratic states, as well as a reversal from the Democratic highs of 2008 and 2009, or even the more recent 2012.
Previously, Gallup observed that the "greatest movement away from the Democratic Party came between 2009 and 2010, when the number of states with a Democratic advantage fell from 34 to 23". At the time, Gallup concluded that "President Obama faces a much less favorable environment as he seeks a second term in office than he did when he was elected president." There have been less significant partisan shifts among the U.S. states since 2011.
Cook Partisan Voting Index (PVI)
Another metric to measure how much a state leans towards one party or the other is the Cook Partisan Voting Index (PVI). Cook PVIs are calculated by comparing a state's average Democratic Party or Republican Party share of the two-party presidential vote in the past two presidential elections to the nation's average share of the same. PVIs for the states over the period 1994–2014 can be used to show the trends of U.S. states towards, or away from, one party or the other.
Elections and voter registrations
The following table shows all the U.S. states and to what party (Democratic or Republican) their state governors belong. Also indicated is the majority party of the state legislatures' upper and lower houses as well as U.S. Senate representation. Nebraska's legislature is unicameral, i.e., it has only one legislative house and is officially non-partisan, though party affiliation still has an unofficial influence on the legislative process.
The simplest measure of the party strength in a state's voting population is the breakdown-by-party totals from its voter registration figures (figures that can easily be obtained from the websites of the Secretaries of State or the Boards of Elections of the various states). As of 2014, 28 states and the District of Columbia allow registered voters to indicate a party preference when registering to vote; the following 22 states (mostly in the South and the Midwest) do not provide for party preferences in voter registration: Alabama, Arkansas, Georgia, Hawaii, Idaho, Illinois, Indiana, Michigan, Minnesota, Mississippi, Missouri, Montana, North Dakota, Ohio, South Carolina, Tennessee, Texas, Utah, Vermont, Virginia, Washington and Wisconsin. The partisan breakdown "demographics" provided in the following table are obtained from that state's party registration figures (from late 2014 whenever possible) where indicated. Only Wyoming has a majority of registered voters identifying themselves as Republicans; two states have a majority of registered voters identifying themselves as Democrats: Maryland and Kentucky (since 2010, Louisiana, Pennsylvania and West Virginia have all seen their Democratic-majority registrations slip to just Democratic-pluralities).
For those states that do not allow for registration by party, Gallup's annual polling of voter party identification by state is the next best metric of party strength in the U.S. states. The partisan figures in the table below for the 22 states that don't register voters by party come from Gallup's 2014 polling of voter party identification by state.
Table of U.S. state party statistics
(a) Independent/Third Party. Independent usually caucusing with different party.
(b) Vacancy.
(c) While the Nebraska Legislature is technically non-partisan the majority of the Senators are Republican.
(d) Indicated partisan breakdown numbers are from the registration-by-party figures ("active" registered voters, when applicable) from that state's registered voter statistics (late 2014 party registration figures provided whenever possible).
(e) Indicated partisan breakdown numbers are from the Party Identification by State figures for 2014 from Gallup polling (note: Gallup figures have been rounded to two significant figures on the assumption that figures from polling are less accurate than registration-by-party figures).
(f) The Washington State and New York State Senates currently operate under a coalition between majority Republicans and independent Democrats. Connecticut Senate is tied.
(g) The Alaska State House currently operates under a coalition of Democrats, Republicans and independents.
(h) Partisans who are not caucusing with their own party in the chamber.
Regional breakdowns
Local and regional political circumstances often influence party strength.
State government
The following figure is for Governors as of January 2017:
The following figures for party control of state legislative chambers are as of January 2015:
Presidential election results and congressional delegations
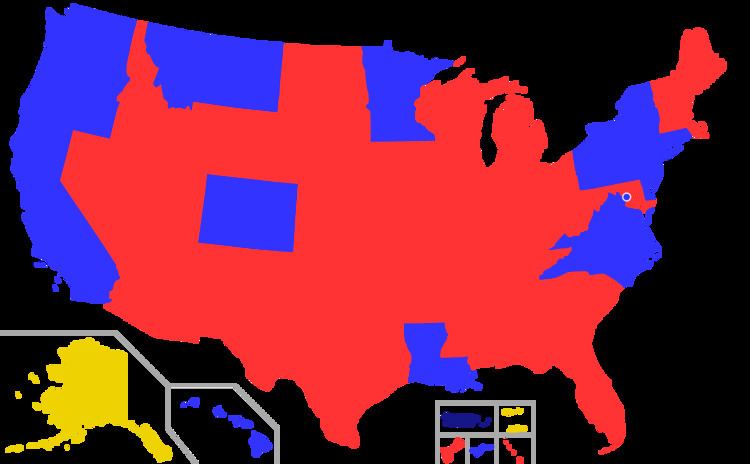
The following is based on the results of the 2016 Presidential election:
The following are the current standings in the U.S. Senate and in the U.S. House as of the 115th Congress:
Historical party strength
The following table shows how many state legislatures were controlled outright by each party.
The following table shows how many governorships were controlled outright by each party.
The following table describes how many state governments are fully controlled by either party or split.