
 | ||
Perceptual mapping is a diagrammatic technique used by asset marketers that attempts to visually display the perceptions of customers or potential customers. Typically the position of a company's product, product line, or brand is displayed relative to their competition. Perceptual maps, also known as market maps, usually have two dimensions but can be multi-dimensional; they can be used to identify gaps in the market and potential partners or merger targets as well as to clarify perceptual problems with a company's product.
Contents
Uses
Perceptual mapping enables companies to better understand their customers: the who, why, where, how and what of their behaviour. If a business is perceived in a manner they find unsatisfactory, further research then identifies what can be done to change that. Perceptual mapping also allows businesses to see what consumers think of other brands, particularly their competitors. Regular uses of the maps can help track preferences, and see changes as they happen. Perceptual mapping can help define market segments, showing clusters of businesses differentiated by key aspects (such as higher class or number of restaurants). Within the clusters found in perceptual maps of entire industries, a business can classify potential partners or possible businesses to merge with, since the clustering of brands signifies the similarity in businesses, meaning they have corresponding attributes. It can also help identify gaps in a market where a new product or service could be introduced. Perceptual maps can also be used to help keep track of how a new product, such as a recently introduced smartphone, is being viewed in a specific market. It is important to see that the way a business is marketing its product is not only successful, but successful in a manner that aligns with the business’s overarching goal for positioning.
Some companies seem to have fallen out of favor with the public, such as Quicken Loans and VW. Perceptual mapping can help elicit the extent of the damage.
Limitations
There are many limitations to perceptual mapping. The largest is the number of variables used. Traditionally, the map uses two variables and does not account for others. This assumption can hinder the reliability of results, as in some cases, it is not safe to assume that there are only two major factors influencing the decision of purchase for a consumer. For example, a graph may use quality of food and pricing, but not take into account other relevant variables such as the number of visits and locations. Also, there is often a blurred line between what a business can offer and what a consumer thinks the business can offer. This could be due to miscommunication, lack of knowledge, impact from social media, and so on. These untruths can influence the result, creating a slight bias in the statistics. Another limitation is data gathering. The data needed to form a perceptual map is usually obtained through surveys, and can be difficult to obtain. The range of behaviours that the map covers is also a constraint, as the limitation to two variables means that its application works mainly with purchase decisions made with little thought and effort, such as purchasing a beverage at a store or going to a fast food restaurant.
Examples
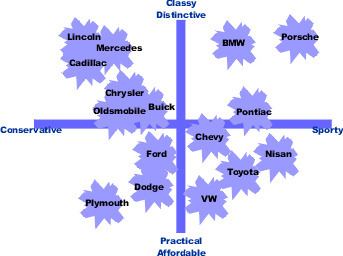
Perceptual maps can have any number of dimensions but the most common is two dimensions. The first perceptual map below shows consumer perceptions of various automobiles on the two dimensions of sportiness/conservative and classy/affordable. This sample of consumers felt Porsche was the sportiest and classiest of the cars in the study (top right corner). They felt Plymouth was most practical and conservative (bottom left corner).
Cars that are positioned close to each other are seen as similar on the relevant dimensions by the consumer. For example, consumers see Buick, Chrysler, and Oldsmobile as similar. They are close competitors and form a competitive grouping. A company considering the introduction of a new model will look for an area on the map free from competitors. Some perceptual maps use different-sized circles to indicate the sales volume or market share of the various competing products.
Displaying consumers’ perceptions of related products is only half the story. Many perceptual maps also display consumers’ ideal points. These points reflect ideal combinations of the two dimensions as seen by a consumer. The next diagram shows a study of consumers’ ideal points in the alcohol/spirits product space. Each dot represents one respondent's ideal combination of the two dimensions. Areas where there is a cluster of ideal points (such as A) indicate a market segment. Areas without ideal points are sometimes referred to as demand voids.
A company considering introducing a new product will look for areas with a high density of ideal points. They will also look for areas without competitive rivals. This is best done by placing both the ideal points and the competing products on the same map.
Some maps plot ideal vectors instead of ideal points. The map below displays various aspirin products as seen on the dimensions of effectiveness and gentleness. It also shows two ideal vectors. The slope of the ideal vector indicates the ratio of the two dimensions preferred by those consumers within that segment. This study indicates that there is one segment that is more concerned with effectiveness than harshness, and another segment that is more interested in gentleness than strength.
Spidergrams
Spidergrams are an alternative to perceptual mapping that similarly are visual marketing tools; however, spidergrams also request customers to rate attributes.
Multidimensional perceptual maps
Traditional perceptual maps are built with two visual dimensions (X and Y axis). Multidimensional perceptual maps are built with more dimensions visualised as profile charts in small map regions, and then items are mapped to the regions by their similarity to the vectors that represent the region. A common technique to construct this kind of multidimensional perceptual maps is the self-organizing map. This helps pinpoint more variables, allowing for more in-depth research into what influences the consumer. This means that the perceptual map can be applied beyond low-involvement purchases, and also helps with identification of segments in a market.
Intuitive maps
Perceptual maps need not come from a detailed study. There are also intuitive maps (also called judgmental maps or consensus maps) that are created by marketers based on their understanding of their industry. These are limited by not being based on consumer data.
When detailed marketing research studies are done methodological problems can arise, but at least the information is coming directly from the consumer. An assortment of statistical procedures can be used to convert the raw data collected in a survey into a perceptual map. Preference regression will produce ideal vectors. Multi dimensional scaling will produce either ideal points or competitor positions. Factor analysis, discriminant analysis, cluster analysis and logit analysis can also be used. Some techniques are constructed from perceived differences between products, others from perceived similarities, and still others from cross price elasticity of demand data from electronic scanners.
Modern techniques
Marketers can reveal shoppers' collective perceptual map with increasing precision and detail by aggregating and analysing their data; this is done, for example, in the smartphone and laptop industries.
Furthermore, they can be used in non-commercial applications, such as identifying factors involved in dangerous driving.