
County Butte FIPS code 06-54388 Area 57.82 km² Zip code 95965 | Time zone PST (UTC-8) GNIS feature IDs 2409001 Population 8,280 (2010) Area code 530 | |
 | ||
Oroville East or Kelly Ridge is a census-designated place (CDP) in Butte County, California, United States. The population was 8,280 at the 2010 census, down from 8,680 at the 2000 census. Most citizens are dependent on the commerce of Oroville, and the vast majority of high school students in Kelly Ridge (Oroville East) attend Las Plumas High School.
Contents
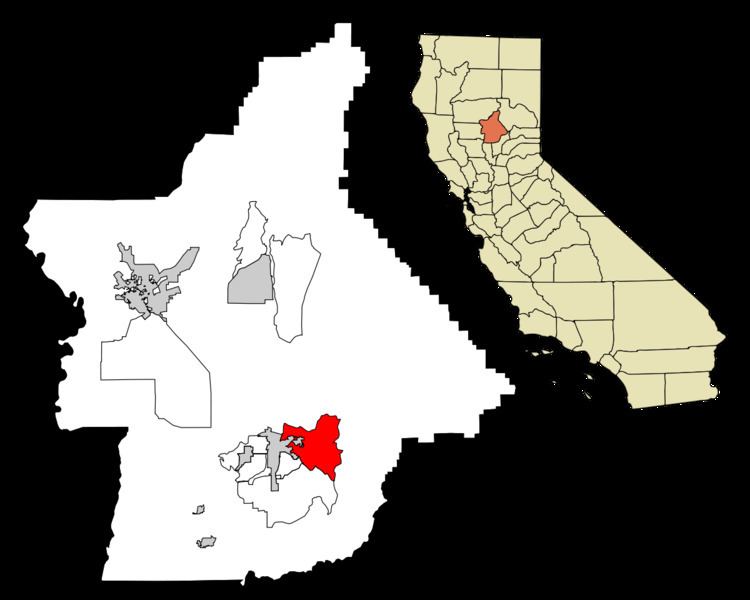
Map of Oroville East, CA 95966, USA
Geography
Oroville East is located at 39°30′42″N 121°30′16″W (39.511805, -121.504345).
According to the United States Census Bureau, the CDP has a total area of 22.3 square miles (58 km2), of which, 22.1 square miles (57 km2) of it is land and 0.2 square miles (0.52 km2) of it (0.79%) is water.
2010
The 2010 United States Census reported that Oroville East had a population of 8,280. The population density was 370.9 people per square mile (143.2/km²). The racial makeup of Oroville East was 6,830 (82.5%) White, 126 (1.5%) African American, 477 (5.8%) Native American, 294 (3.6%) Asian, 8 (0.1%) Pacific Islander, 147 (1.8%) from other races, and 398 (4.8%) from two or more races. Hispanic or Latino of any race were 702 persons (8.5%).
The Census reported that 8,265 people (99.8% of the population) lived in households, 15 (0.2%) lived in non-institutionalized group quarters, and 0 (0%) were institutionalized.
There were 3,349 households, out of which 856 (25.6%) had children under the age of 18 living in them, 1,775 (53.0%) were opposite-sex married couples living together, 348 (10.4%) had a female householder with no husband present, 181 (5.4%) had a male householder with no wife present. There were 245 (7.3%) unmarried opposite-sex partnerships, and 25 (0.7%) same-sex married couples or partnerships. 847 households (25.3%) were made up of individuals and 486 (14.5%) had someone living alone who was 65 years of age or older. The average household size was 2.47. There were 2,304 families (68.8% of all households); the average family size was 2.91.
The population was spread out with 1,665 people (20.1%) under the age of 18, 578 people (7.0%) aged 18 to 24, 1,490 people (18.0%) aged 25 to 44, 2,638 people (31.9%) aged 45 to 64, and 1,909 people (23.1%) who were 65 years of age or older. The median age was 48.8 years. For every 100 females there were 97.5 males. For every 100 females age 18 and over, there were 95.5 males.
There were 3,674 housing units at an average density of 164.6 per square mile (63.5/km²), of which 2,701 (80.7%) were owner-occupied, and 648 (19.3%) were occupied by renters. The homeowner vacancy rate was 3.2%; the rental vacancy rate was 9.0%. 6,414 people (77.5% of the population) lived in owner-occupied housing units and 1,851 people (22.4%) lived in rental housing units.
2000
As of the census of 2000, there were 8,680 people, 3,709 households, and 2,618 families residing in the CDP. The population density was 419.6 people per square mile (162.0/km²). There were 4,078 housing units at an average density of 197.1 per square mile (76.1/km²). The racial makeup of the CDP was 90.65% White, 0.66% Black or African American, 3.19% Native American, 0.92% Asian, 0.18% Pacific Islander, 1.39% from other races, and 3.01% from two or more races. 4.56% of the population were Hispanic or Latino of any race.
There were 3,709 households out of which 21.5% had children under the age of 18 living with them, 59.3% were married couples living together, 8.0% had a female householder with no husband present, and 29.4% were non-families. 24.8% of all households were made up of individuals and 15.0% had someone living alone who was 65 years of age or older. The average household size was 2.34 and the average family size was 2.75.
In the CDP, the population was spread out with 20.1% under the age of 18, 4.9% from 18 to 24, 19.0% from 25 to 44, 28.0% from 45 to 64, and 27.9% who were 65 years of age or older. The median age was 49 years. For every 100 females there were 93.6 males. For every 100 females age 18 and over, there were 90.3 males.
The median income for a household in the CDP was $41,195, and the median income for a family was $46,543. Males had a median income of $36,009 versus $25,214 for females. The per capita income for the CDP was $21,508. About 4.6% of families and 8.2% of the population were below the poverty line, including 15.7% of those under age 18 and 4.3% of those age 65 or over.