
Quality characteristic type Attributes data Size of shift to detect ≥ 1.5σ | Rational subgroup size n > 1 Underlying distribution | |
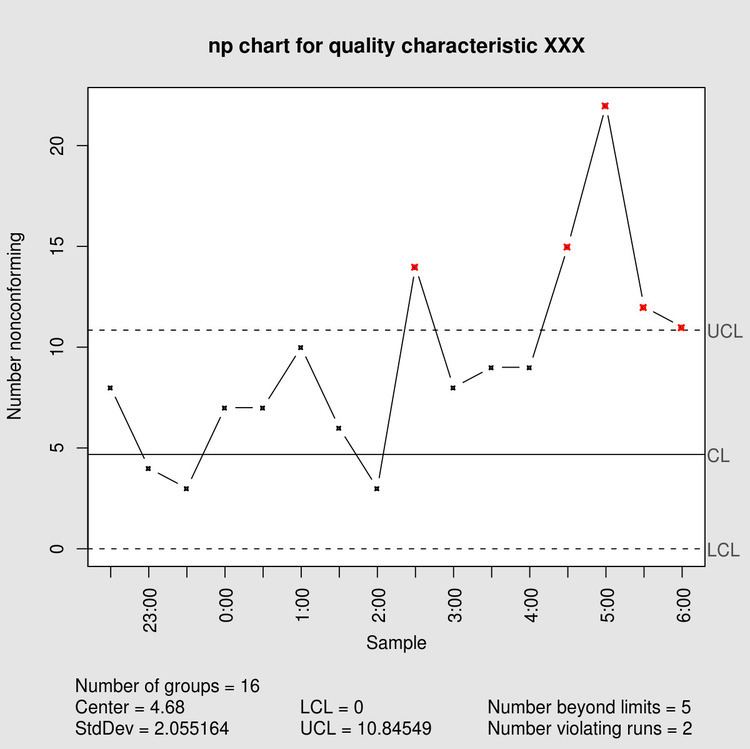 | ||
Measurement type Number nonconforming per unit | ||
In statistical quality control, the np-chart is a type of control chart used to monitor the number of nonconforming units in a sample. It is an adaptation of the p-chart and used in situations where personnel find it easier to interpret process performance in terms of concrete numbers of units rather than the somewhat more abstract proportion.
The np-chart differs from the p-chart in only the three following aspects:
- The control limits are
n p ¯ ± 3 n p ¯ ( 1 − p ¯ ) p ¯ - The number nonconforming (np), rather than the fraction nonconforming (p), is plotted against the control limits.
- The sample size,
n , is constant.
References
Np-chart Wikipedia(Text) CC BY-SA