
PDF see text Mean see text | CDF see text Mode see text | |
 | ||
Support x ∈ ( − ∞ ; + ∞ ) {displaystyle xin (-infty ;+infty ),!} | ||
As with other noncentrality parameters, the noncentral t-distribution generalizes a probability distribution – Student's t-distribution – using a noncentrality parameter. Whereas the central distribution describes how a test statistic t is distributed when the difference tested is null, the noncentral distribution describes how t is distributed when the null is false. This leads to its use in statistics, especially calculating statistical power. The noncentral t-distribution is also known as the singly noncentral t-distribution, and in addition to its primary use in statistical inference, is also used in robust modeling for data.
Contents
Characterization
If Z is a normally distributed random variable with unit variance and zero mean, and V is a Chi-squared distributed random variable with ν degrees of freedom that is statistically independent of Z, then
is a noncentral t-distributed random variable with ν degrees of freedom and noncentrality parameter μ. Note that the noncentrality parameter may be negative.
Cumulative distribution function
The cumulative distribution function of noncentral t-distribution with ν degrees of freedom and noncentrality parameter μ can be expressed as
where
and Φ is the cumulative distribution function of the standard normal distribution.
Alternatively, the noncentral t-distribution CDF can be expressed as:
where Γ is the gamma function and I is the regularized incomplete beta function.
Although there are other forms of the cumulative distribution function, the first form presented above is very easy to evaluate through recursive computing. In statistical software R, the cumulative distribution function is implemented as pt.
Probability density function
The probability density function (pdf) for the noncentral t-distribution with ν > 0 degrees of freedom and noncentrality parameter μ can be expressed in several forms.
The confluent hypergeometric function form of the density function is
where 1F1 is a confluent hypergeometric function.
An alternative integral form is
A third form of the density is obtained using its cumulative distribution functions, as follows.
This is the approach implemented by the dt function in R.
Differential equation
The pdf of the noncentral t-distribution is a solution of the following differential equation:
Moments of the Noncentral t-distribution
In general, the kth raw moment of the noncentral t-distribution is
In particular, the mean and variance of the noncentral t-distribution are
An excellent approximation to
Asymmetry
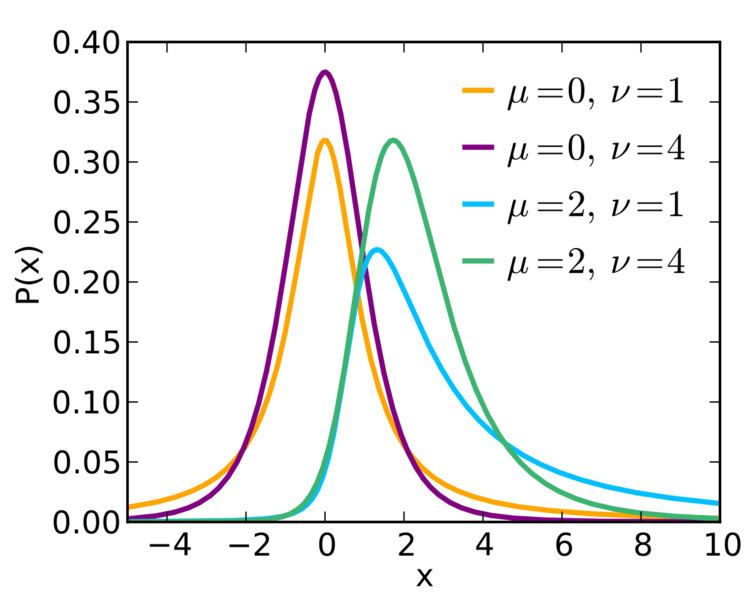
The noncentral t-distribution is asymmetric unless μ is zero, i.e., a central t-distribution. The right tail will be heavier than the left when μ > 0, and vice versa. However, the usual skewness is not generally a good measure of asymmetry for this distribution, because if the degrees of freedom is not larger than 3, the third moment does not exist at all. Even if the degrees of freedom is greater than 3, the sample estimate of the skewness is still very unstable unless the sample size is very large.
Mode
The noncentral t-distribution is always unimodal and bell shaped, but the mode is not analytically available, although for μ ≠ 0 we have
In particular, the mode always has the same sign as the noncentrality parameter μ. Moreover, the negative of the mode is exactly the mode for a noncentral t-distribution with the same number of degrees of freedom ν but noncentrality parameter −μ.
The mode is strictly increasing with μ when μ > 0 and strictly decreasing with μ when μ < 0. In the limit, when μ → 0, the mode is approximated by
and when μ → ∞, the mode is approximated by
Use in power analysis
Suppose we have an independent and identically distributed sample X1, ..., Xn each of which is normally distributed with mean θ and variance σ2, and we are interested in testing the null hypothesis θ = 0 vs. the alternative hypothesis θ ≠ 0. We can perform a one sample t-test using the test statistic
where
If the test procedure rejects the null hypothesis whenever
Similar applications of the noncentral t-distribution can be found in the power analysis of the general normal-theory linear models, which includes the above one sample t-test as a special case.
Use in tolerance intervals
One-sided normal tolerance intervals have an exact solution in terms of the sample mean and sample variance based on the noncentral t-distribution. This enables the calculation of a statistical interval within which, with some confidence level, a specified proportion of a sampled population falls.