
 | ||
Non-Hispanic whites or whites not of Hispanic or Latino origin or "Anglo," are people in the United States who, as defined by the Census Bureau, are considered racially white and are not of Hispanic or Latino origin/ethnicity. Non-Hispanic whites are a subcategory of white Americans, the other being white Hispanic and Latino Americans.
Contents
Although generally all nations in Europe have contributed to the white population through emigration to Northern America in the last few centuries, the majority of non-Hispanic whites trace their origins to Northwestern Europe while other major sources originate in Southern and Eastern Europe; German, Irish, and English ancestries are the most common.
In the United States, this population was first derived from English (and, to a lesser degree, French) settlement of the Americas, as well as settlement by other Europeans such as the Germans and Dutch that began in the 17th century (see History of the United States). Continued growth since the early 19th century is attributed to sustained very high birth rates alongside relatively low death rates among settlers and natives alike as well as periodically massive immigration from European countries, especially Germany, Ireland, England, Italy, Greece, Sweden and Norway, as well as Poland, Russia, and many more countries. In 2011, for the first time in U.S. history, non-Hispanic whites accounted for under half of the births in the country, with 49.6% of total births. At 197.2 million in 2012, non-Hispanic whites comprise 62.8% of the total U.S. population.
Trends
The Non-Hispanic white population in the United States has been declining since the 1940s as a percentage of the total US population due to a number of factors:
1. Lower birth rates. Non-Hispanic whites are having fewer children relative to other groups. Preliminary 2012 data show that non-Hispanic whites have a total fertility rate of 1.76 children per woman, compared to 1.90 for non-Hispanic blacks, 2.19 for Hispanics, and 1.77 for Asians. Since 1990, rates for other races have been falling while the non-Hispanic white rate has been more or less stable, but the two largest groups, Hispanics and non-Hispanic blacks, remain higher. Since 1997, Asian fertility has been lower than that of non-Hispanic whites except during a Year of the Dragon (2000 and 2012), but the Asian population structure has relatively more women of childbearing age and fewer elderly than the white population does, leading to Asians having a higher crude birth rate and lower crude death rate than whites.
2. Immigration. The U.S. takes more immigrants than the rest of the world combined with the vast majority coming from countries where the population is of non-white and/or Hispanic origin. Immigration to the U.S. from European countries has been in a steady decline since World War II averaging 56% of all immigrants in the 1950s and declining to 35% of all immigrants in the 1960s, 20% in the 1970s, 11% in the 1980s, 14% in the 1990s, and 13% in the 2000s. In 2009, approximately 90% of all immigrants came from non-European countries. The U.S. does receive a small number of non-Hispanic white immigrants, mainly from countries such as Brazil, Canada, Poland, Russia, and the U.K., as well as Egypt and Iran.
3. Intermarriage. The USA is seeing an unprecedented increase in intermarriage between the various racial and ethnic groups. In 2008, a record 14.6% of all new marriages in the United States were between spouses of a different race or ethnicity from one another. 9% of non-Hispanic whites who married in 2008 married either a non-white or Hispanic. Among all newlyweds in 2008, intermarried pairings were primarily white-Hispanic of any race (41%) as compared to white-Asian (15%), white-black (11%), and other combinations (33%). Other combinations consists of pairings between different minority groups, multi-racial people, and American Indians. The children of such unions would not generally be classified as white Non-Hispanic (although note that one self-identifies their racial and/or ethnic category).
4. Methodology. In the 2000 Census, people were allowed to check more than one race in addition to choosing "Hispanic." There was strong opposition to this from some civil rights activists who feared that this would reduce the size of various racial minorities. The government responded by counting those who are white and of one minority race or ethnicity as minorities for the purposes of civil-rights monitoring and enforcement. Hence one could be 1/8th black and still be counted as a minority. Also, because this does not apply to Hispanic origin (one is either Hispanic or not, but cannot be both Hispanic and non-Hispanic), the offspring of Hispanics and non-Hispanics are usually counted as Hispanic.
5. Attrition. Minority populations are younger than non-Hispanic whites. The national median age in 2011 was 37.3 with non-Hispanic whites having the oldest median age (42.3) while Hispanics have the youngest (27.6). Non-Hispanic blacks (32.9) and non-Hispanic Asians (35.9) also are younger than whites. In 2013, the Census Bureau reported that for the first time, due to the more advanced age profile of the non-Hispanic white population, non-Hispanic whites died at a faster rate than non-Hispanic white births.
Although non-Hispanic whites are declining as a percentage, in actual numbers they have still been growing. From 2000 - 2010 the non-Hispanic white population grew from 194,552,774 to 196,817,552 - A growth of 1.2% over the 10-year period, due to residual population momentum.
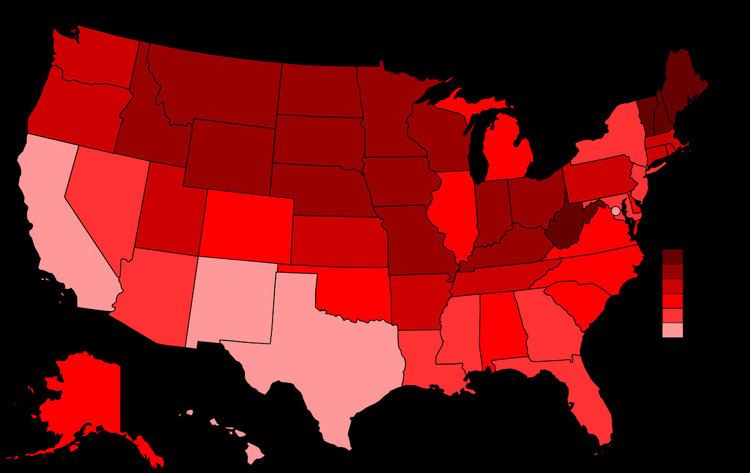
Population by state or territory
In 2012, in 37 out of the 50 U.S. states non-Hispanic whites made up a greater percentage of the state's population than the U.S. overall share of 62.8%; however, the 13 states with greater shares of non-whites include the four most populous states (California, Texas, New York, and Florida). Also, note that while the total non-Hispanic white population has grown since 2000 in 36 out of the 50 states, the relative share of non-Hispanic whites in the overall state population has declined in all 50 states during that same time period.
As of 2012, four states are majority-minority: Hawaii, California, New Mexico, and Texas.