
Country Switzerland Elevation 485 m Local time Thursday 1:22 PM | SFOS number 5641 Population 389 (31 Dec 2008) Postal code 1125 | |
 | ||
Surrounded by Weather 11°C, Wind E at 2 km/h, 60% Humidity | ||
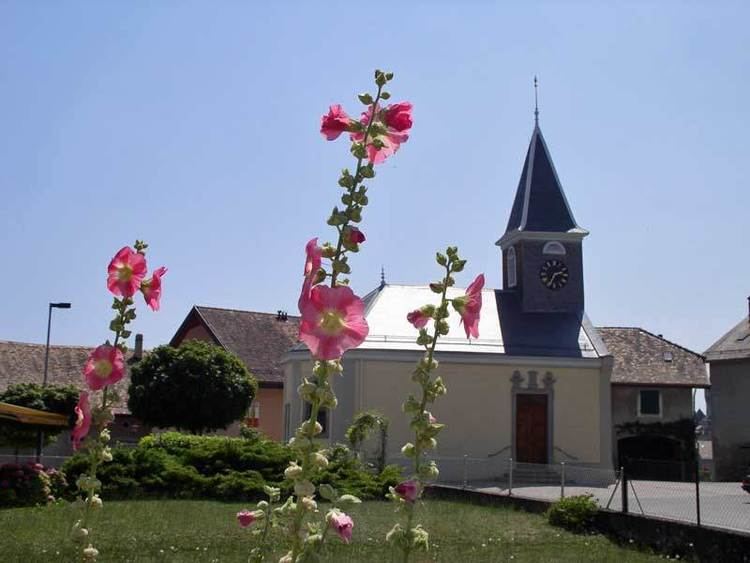
Monnaz is a former municipality in the Swiss canton of Vaud, located in the district of Morges.
Contents
- Map of 1125 Monnaz Switzerland
- History
- Geography
- Coat of arms
- Demographics
- Politics
- Economy
- Religion
- Education
- References
Map of 1125 Monnaz, Switzerland
The municipalities of Colombier, Monnaz and Saint-Saphorin-sur-Morges merged on 1 July 2011 into the municipality of Echichens.
History
Monnaz is first mentioned in 1200 as Monna. In 1221 it was mentioned as Muna.
Geography
Monnaz had an area, as of 2009, of 1.6 square kilometers (0.62 sq mi). Of this area, 1.17 km2 (0.45 sq mi) or 72.7% is used for agricultural purposes, while 0.27 km2 (0.10 sq mi) or 16.8% is forested. Of the rest of the land, 0.15 km2 (37 acres) or 9.3% is settled (buildings or roads).
Of the built up area, housing and buildings made up 6.8% and transportation infrastructure made up 1.9%. Out of the forested land, 13.0% of the total land area is heavily forested and 3.7% is covered with orchards or small clusters of trees. Of the agricultural land, 65.8% is used for growing crops and 1.9% is pastures, while 5.0% is used for orchards or vine crops.
The municipality was part of the Morges District until it was dissolved on 31 August 2006, and Monnaz became part of the new district of Morges.
The former municipality is located on the left bank of the Morges river.
Coat of arms
The blazon of the municipal coat of arms is Azure, a Saltire Or, two Grape bunches and as many Mullets of Five of the same.
Demographics
Monnaz has a population (As of 2009) of 396. As of 2008, 15.9% of the population are resident foreign nationals. Over the last 10 years (1999–2009 ) the population has changed at a rate of 43.5%. It has changed at a rate of 29% due to migration and at a rate of 14.9% due to births and deaths.
Most of the population (as of 2000) speaks French (244 or 87.5%), with German being second most common (21 or 7.5%) and Swedish being third (5 or 1.8%). There are 4 people who speak Italian.
Of the population in the municipality 57 or about 20.4% were born in Monnaz and lived there in 2000. There were 91 or 32.6% who were born in the same canton, while 67 or 24.0% were born somewhere else in Switzerland, and 57 or 20.4% were born outside of Switzerland.
In 2008 there were 5 live births to Swiss citizens and 1 birth to non-Swiss citizens. Ignoring immigration and emigration, the population of Swiss citizens increased by 5 while the foreign population increased by 1. There were 3 Swiss men and 8 Swiss women who emigrated from Switzerland. At the same time, there were 3 non-Swiss men and 1 non-Swiss woman who immigrated from another country to Switzerland. The total Swiss population change in 2008 (from all sources, including moves across municipal borders) was a decrease of 16 and the non-Swiss population increased by 1 people. This represents a population growth rate of -3.7%.
The age distribution, as of 2009, in Monnaz is; 52 children or 13.2% of the population are between 0 and 9 years old and 72 teenagers or 18.2% are between 10 and 19. Of the adult population, 30 people or 7.6% of the population are between 20 and 29 years old. 38 people or 9.6% are between 30 and 39, 75 people or 19.0% are between 40 and 49, and 55 people or 13.9% are between 50 and 59. The senior population distribution is 36 people or 9.1% of the population are between 60 and 69 years old, 29 people or 7.3% are between 70 and 79, there are 7 people or 1.8% who are between 80 and 89, and there is 1 person who is 90 and older.
As of 2000, there were 109 people who were single and never married in the municipality. There were 144 married individuals, 12 widows or widowers and 14 individuals who are divorced.
As of 2000 the average number of residents per living room was 0.51 which is fewer people per room than the cantonal average of 0.61 per room. In this case, a room is defined as space of a housing unit of at least 4 m² (43 sq ft) as normal bedrooms, dining rooms, living rooms, kitchens and habitable cellars and attics. About 59.8% of the total households were owner occupied, or in other words did not pay rent (though they may have a mortgage or a rent-to-own agreement).
As of 2000, there were 111 private households in the municipality, and an average of 2.5 persons per household. There were 29 households that consist of only one person and 9 households with five or more people. Out of a total of 116 households that answered this question, 25.0% were households made up of just one person and there was 1 adult who lived with their parents. Of the rest of the households, there are 37 married couples without children, 37 married couples with children There were 4 single parents with a child or children. There were 3 households that were made up of unrelated people and 5 households that were made up of some sort of institution or another collective housing.
In 2000 there were 45 single family homes (or 59.2% of the total) out of a total of 76 inhabited buildings. There were 17 multi-family buildings (22.4%), along with 11 multi-purpose buildings that were mostly used for housing (14.5%) and 3 other use buildings (commercial or industrial) that also had some housing (3.9%). Of the single family homes 6 were built before 1919, while 5 were built between 1990 and 2000. The greatest number of single family homes (13) were built between 1981 and 1990. The most multi-family homes (6) were built between 1961 and 1970 and the next most (4) were built before 1919.
In 2000 there were 116 apartments in the municipality. The most common apartment size was 4 rooms of which there were 38. There were 5 single room apartments and 54 apartments with five or more rooms. Of these apartments, a total of 107 apartments (92.2% of the total) were permanently occupied, while 8 apartments (6.9%) were seasonally occupied and one apartment was empty. As of 2009, the construction rate of new housing units was 0 new units per 1000 residents. The vacancy rate for the municipality, in 2010, was 0.64%.
The historical population is given in the following chart:
Politics
In the 2007 federal election the most popular party was the Green Party which received 22.61% of the vote. The next three most popular parties were the SVP (21.56%), the SP (19.92%) and the FDP (15.52%). In the federal election, a total of 136 votes were cast, and the voter turnout was 57.6%.
Economy
As of 2010, Monnaz had an unemployment rate of 3.8%. As of 2008, there were 17 people employed in the primary economic sector and about 6 businesses involved in this sector. 4 people were employed in the secondary sector and there were 3 businesses in this sector. 19 people were employed in the tertiary sector, with 9 businesses in this sector. There were 141 residents of the municipality who were employed in some capacity, of which females made up 44.7% of the workforce.
In 2008 the total number of full-time equivalent jobs was 30. The number of jobs in the primary sector was 10, all of which were in agriculture. The number of jobs in the secondary sector was 4 of which 3 or (75.0%) were in manufacturing and 1 was in construction. The number of jobs in the tertiary sector was 16. In the tertiary sector; 1 was in the sale or repair of motor vehicles, 2 or 12.5% were in the information industry, 8 or 50.0% were technical professionals or scientists, .
In 2000, there were 8 workers who commuted into the municipality and 110 workers who commuted away. The municipality is a net exporter of workers, with about 13.8 workers leaving the municipality for every one entering. Of the working population, 11.3% used public transportation to get to work, and 68.8% used a private car.
Religion
From the 2000 census, 64 or 22.9% were Roman Catholic, while 171 or 61.3% belonged to the Swiss Reformed Church. Of the rest of the population, there were 3 members of an Orthodox church (or about 1.08% of the population), and there were 2 individuals (or about 0.72% of the population) who belonged to another Christian church. 35 (or about 12.54% of the population) belonged to no church, are agnostic or atheist, and 4 individuals (or about 1.43% of the population) did not answer the question.
Education
In Monnaz about 105 or (37.6%) of the population have completed non-mandatory upper secondary education, and 63 or (22.6%) have completed additional higher education (either University or a Fachhochschule). Of the 63 who completed tertiary schooling, 50.8% were Swiss men, 25.4% were Swiss women, 15.9% were non-Swiss men and 7.9% were non-Swiss women.
In the 2009/2010 school year there were a total of 72 students in the Monnaz school district. In the Vaud cantonal school system, two years of non-obligatory pre-school are provided by the political districts. During the school year, the political district provided pre-school care for a total of 631 children of which 203 children (32.2%) received subsidized pre-school care. The canton's primary school program requires students to attend for four years. There were 29 students in the municipal primary school program. The obligatory lower secondary school program lasts for six years and there were 42 students in those schools. There were also 1 students who were home schooled or attended another non-traditional school.
As of 2000, there was one student in Monnaz who came from another municipality, while 40 residents attended schools outside the municipality.