
 | ||
Median income is the amount that divides the income distribution into two equal groups, half having income above that amount, and half having income below that amount. Mean income (average) is the amount obtained by dividing the total aggregate income of a group by the number of units in that group.
Contents
- Gallup gross median household income
- Median equivalent adult income
- Median household income and the US economy
- References
Median income can be calculated by household income, by personal income, or for specific demographic groups.
Gallup gross median household income
In 2013, Gallup published a list of countries with median household income, based on a self-reported survey of approximately 1000 adults from each country. Using median, rather than mean income, results in a much more accurate picture of the typical income of the middle class since the data will not be skewed by gains and abnormalities in the extreme ends. The figures are in international dollars using purchasing power parity and are based on responses from at least 2,000 adults in each country, with the data aggregated from 2006 to 2012. Below is a list of the top 30 countries. The figures do not take taxes and social contributions into account.
* The US Census reports that median household money income during the 2006-2012 period averaged over $50,000, therefore by comparison, the Gallup result is underreported compared to Census' own figures. A study on the Census income data claims that when correcting for underreporting, U.S. gross median household income was $57,739 in 2010 (table 3).
Median equivalent adult income
The annual median equivalence disposable household income for selected OECD countries is shown in the table below. This is the disposable income of an equivalent adult in a household in the middle of the income distribution in a year.
Data are in United States dollars at current prices and current purchasing power parity for private consumption for the reference year.
Median household income and the US economy
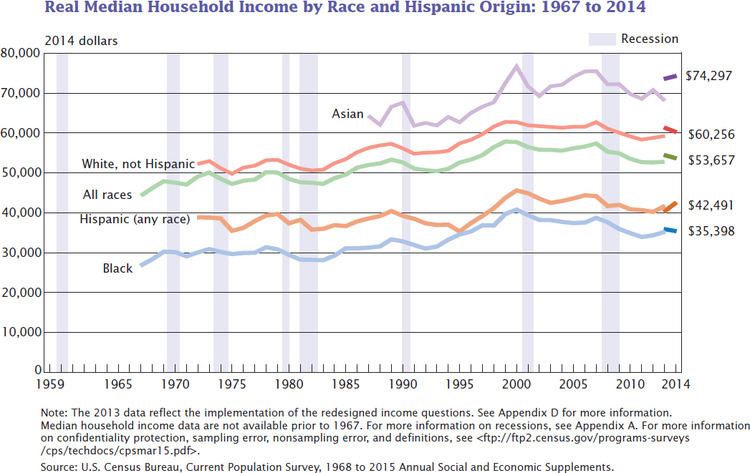
Since 1980, U.S. gross domestic product (GDP) per capita has increased 67%, while median household income has only increased by 15%.
Median household income is a politically sensitive indicator. Voters can be critical of their government if they perceive that their cost of living is rising faster than their income. Figure 1 shows how American incomes have changed since 1970. The last recession was the early 2000s recession and was started with the bursting of the dot-com bubble. It affected most advanced economies including the European Union, Japan and the United States. An economic recession will normally cause household incomes to decrease, often by as much as 10% (Figure 1).
The Late-2000s recession began with the bursting of the U.S. housing bubble, which caused a problem in the dangerously exposed sub prime-mortgage market. This in turn triggered a global financial crisis. In constant price, 2011 American median household income was 1.13% lower than what it was in 1989. This corresponds to a 0.05% annual decrease over a 22-year period. In the mean time, GDP per capita has increased by 33.8% or 1.33% annually.
A comparison between Median Equivalised Household Income and GDP per Capita in USD for select developed countries is shown in the chart below.
In 2015, the median household income spiked 5.2 percent, reaching $56,000, making it the first annual hike in median household income since the start of the Great Recession.