
 | ||
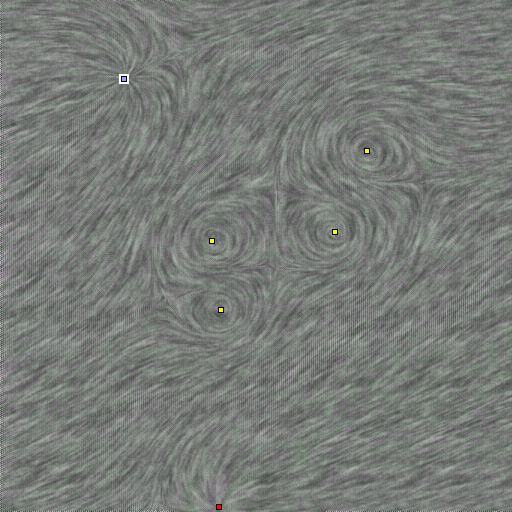
In scientific visualization, line integral convolution (LIC) is a technique proposed by Brian Cabral and Leith Leedom to visualize fluid motion, such as the wind movement in a tornado. Compared with simpler integration-like techniques, where one follows the flow vector at each point to produce a line, it has the advantage of producing a whole image at every step. It is a method from the texture advection family.
Contents
Intuition
Intuitively, the flow of a vector field is visualized by adding a random static pattern of dark and light paint sources. As the flow passes by the sources each parcel of fluid picks up some of the source color, averaging it with the color it has already acquired. Very similar to throwing paint in a river. The result is a random striped texture where points along the same streamline tend to have similar color.
Algorithm
Algorithmically, the technique generates a random gray level image at the desired output resolution. Then, for every pixel in the image, the forward and backward streamline of a fixed arc length is calculated. The convolution of a suitable convolution kernel with the gray levels of all the pixels that lie in this streamline is the value assigned to the current pixel in the output image.
Mathematic description
Mathematically: let
where
The output image will normally be colored in some way. For the tornado example, the LIC output could determine the brightness of the color, while the vector length at each point would determine its hue. Different choices of convolution kernels and random noise can also produce different textures: for example pink noise produces a cloudy pattern where areas of higher flow stand out as smearing, suitable for weather visualisations. Further refinements in the convolution can improve the quality of the image.
Animated version
LICs can be animated by using a kernel that changes over time. Samples at a constant time from the streamline would still be used, but instead of averaging all pixels in a streamline with a static kernel, a ripple-like kernel constructed from a periodic function multiplied by a Hann function acting as a window (in order to prevent artifacts) is used. The periodic function is then shifted along the period to create an animation.
Usability
In user testing the method was found to be particularly good for identifying critical points, but at least in the static case the method does not give an indication of the flow direction.
The main drawback of the method is the high computational demands. For each pixel 20-50 advected points have to be calculated, limiting interactivity. Performance can be improved by re-using parts of already computed streamlines. Various methods of graphics hardware acceleration have been attempted, mixing the pure convolution method with image-based flow visualization.