
 | ||
Laboratory quality control is designed to detect, reduce, and correct deficiencies in a laboratory's internal analytical process prior to the release of patient results, in order to improve the quality of the results reported by the laboratory. Quality control is a measure of precision, or how well the measurement system reproduces the same result over time and under varying operating conditions. Laboratory quality control material is usually run at the beginning of each shift, after an instrument is serviced, when reagent lots are changed, after calibration, and whenever patient results seem inappropriate. Quality control material should approximate the same matrix as patient specimens, taking into account properties such as viscosity, turbidity, composition, and color. It should be simple to use, with minimal vial to vial variability, because variability could be misinterpreted as systematic error in the method or instrument. It should be stable for long periods of time, and available in large enough quantities for a single batch to last at least one year. Liquid controls are more convenient than lyophilized controls because they do not have to be reconstituted minimizing pipetting error.
Contents
Interpretation
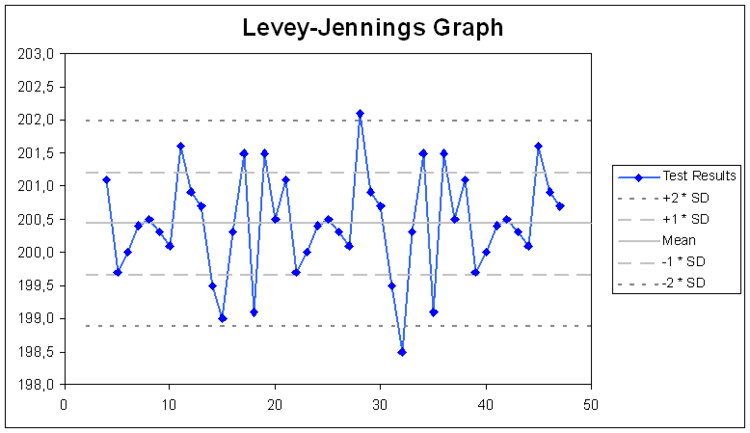
Interpretation of quality control data involves both graphical and statistical methods. Quality control data is most easily visualized using a Levey-Jennings chart. The dates of analyses are plotted along the X-axis and control values are plotted on the Y-axis. The mean and one, two, and three standard deviation limits are also marked on the Y-axis. Inspecting the pattern of plotted points provides a simple way to detect increased random error and shifts or trends in calibration.
The control charts
The control charts: a statistical approach to the study of manufacturing process variation for the purpose of improving the economic effectiveness of the process. These methods are based on continuous monitoring of process variation. The control chart, also known as the 'Shewhart chart' or 'process-behavior chart' is a statistical tool intended to assess the nature of variation in a process and to facilitate forecasting and management. A control chart is a more specific kind of a run chart. The control chart is one of the seven basic tools of quality control which include the histogram, pareto chart, check sheet, control chart, cause and effect diagram, flowchart and scatter diagram. Control charts prevents unnecessary process adjustments; provides information about process capability; provides diagnostic information and it is a proven technique for improving productivity.
Levey–Jennings chart
Levey-Jennings chart is a graph that quality control data is plotted on to give a visual indication whether a laboratory test is working well.The distance from the mean is measured in standard deviations (SD). It is named after S. Levey and E. R. Jennings who in 1950 suggested the use of Shewhart's individuals control chart in the clinical laboratory. On the x-axis the date and time, or more usually the number of the control run, are plotted. A mark is made indicating how far away the actual result was from the mean (which is the expected value for the control). Lines run across the graph at the mean, as well as one, two and three standard deviations to either side of the mean. This makes it easy to see how far off the result was.
Rules, such as the Westgard rules can be applied to see whether the results from the samples when the control was done can be released, or if they need to be rerun. The formulation of Westgard rules were based on statistical methods. Westgard rules are commonly used to analyse data in Shewhart control charts. Westgard rules are used to define specific performance limits for a particular assay and can be used to detect both random and systematic errors. Westgard rules are programmed in to automated analyzers to determine when an analytical run should be rejected. These rules need to be applied carefully so that true errors are detected while false rejections are minimized. The rules applied to high volume chemistry and hematology instruments should produce low false rejection rates.
The Levey-Jennings chart differs from the Shewhart individuals control chart in the way that sigma, the standard deviation, is estimated. The Levey-Jennings chart uses the long-term (i.e., population) estimate of sigma whereas the Shewhart chart uses the short-term (i.e., within the rational subgroup) estimate.