
 | ||
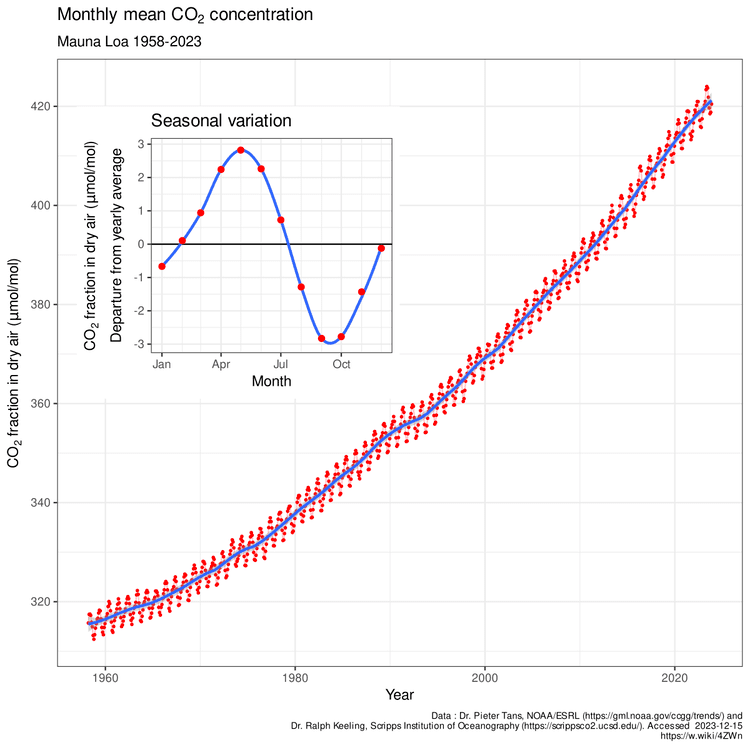
The Keeling Curve is a graph which plots the ongoing change in concentration of carbon dioxide in Earth's atmosphere since the 1950s. It is based on continuous measurements taken at the Mauna Loa Observatory in Hawaii that began under the supervision of Charles David Keeling. Keeling's measurements showed the first significant evidence of rapidly increasing carbon dioxide levels in the atmosphere. Many scientists credit Keeling's graph with first bringing the world's attention to the current increase of carbon dioxide in the atmosphere.
Charles David Keeling, of Scripps Institution of Oceanography at UC San Diego, was the first person to make frequent regular measurements of the atmospheric carbon dioxide (CO2) concentration, taking readings at the South Pole and in Hawaii from 1958 onwards.
Measurements of carbon dioxide concentrations in the atmosphere had been taken prior to the Maunu Loa measurements, but on an ad-hoc basis across a variety of locations. Guy Stewart Callendar had shown a steady increase in concentrations since the 19th century. Keeling had perfected the measurement techniques and observed "strong diurnal behavior with steady values of about 310 ppm in the afternoon" at three locations: Big Sur near Monterey, the rain forests of Olympic Peninsula, and high mountain forests in Arizona. By measuring the ratio of two isotopes of carbon, Keeling attributed the diurnal change to respiration from local plants and soils, with afternoon values representative of the "free atmosphere". By 1960, Keeling and his group had determined that the measurement records from California, Antarctica, and Hawaii were long enough to see not just the diurnal and seasonal variations, but also a year-on-year increase that roughly matched the amount of fossil fuels burned per year. In the article that made him famous, Keeling observed: "at the South Pole the observed rate of increase is nearly that to be expected from the combustion of fossil fuel".
Mauna Loa measurements
Due to funding cuts in the mid-1960s, Keeling was forced to abandon continuous monitoring efforts at the South Pole, but he scraped together enough money to maintain operations at Mauna Loa, which have continued to the present day alongside the monitoring program by NOAA.
The measurements collected at Mauna Loa show a steady increase in mean atmospheric CO2 concentration from about 315 parts per million by volume (ppmv) in 1958 to 401 ppmv as of April 2014. This increase in atmospheric CO2 is due to the combustion of fossil fuels, and has been accelerating in recent years. Since carbon dioxide is a greenhouse gas, this has significant implications for global warming. Measurements of carbon dioxide concentration in ancient air bubbles trapped in polar ice cores show that mean atmospheric CO2 concentration has historically been between 275 and 285 ppmv during the Holocene epoch (9,000 BCE onwards), but started rising sharply at the beginning of the nineteenth century.
Keeling and collaborators made measurements on the incoming ocean breeze and above the thermal inversion layer to minimize local contamination from volcanic vents. In addition, the data are normalized to negate any influence from local contamination. Measurements at many other isolated sites have confirmed the long-term trend shown by the Keeling Curve, though no sites have a record as long as Mauna Loa.
The Keeling Curve also shows a cyclic variation of about 5 ppmv in each year corresponding to the seasonal change in uptake of CO2 by the world's land vegetation. Most of this vegetation is in the Northern hemisphere, since this is where most of the land is located. From a maximum in May, the level decreases during the northern spring and summer as new plant growth takes carbon dioxide out of the atmosphere through photosynthesis. After reaching a minimum in September, the level rises again in the northern fall and winter as plants and leaves die off and decay, releasing the gas back into the atmosphere. The impact of green plankton material in the worlds oceans, which may actually be responsible for taking up to 60% of the carbon dioxide out of the atmosphere through photosynthesis is yet to be fathomed though.
Due in part to the significance of Keeling's findings, the NOAA began monitoring CO2 levels worldwide in the 1970s. Today, CO2 levels are monitored at about 100 sites around the globe.
Carbon dioxide measurements at the Mauna Loa observatory in Hawaii are made with a type of infrared spectrophotometer first called a capnograph by its inventor, John Tyndall, in 1864 but now known as a nondispersive infrared sensor. Currently (May, 2013) several laser-based sensors are being added to run concurrently with the IR spectrophotometer at Scripps, while NOAA measurements at Mauna Loa use nondispersive infrared sensor tightly calibrated using WMO standards as the main reference for the curve. Multiple other sensors and technologies are also used at Mauna Loa to augment these measurements.
Charles David Keeling died in 2005. Supervision of the measuring project was taken over by his son, Ralph Keeling, a professor of geochemistry at Scripps Oceanography.
When C.D. Keeling published his 1960 paper, there did not appear to be any evidence of oceanic absorption. Keeling conjectured that this might be attributable to fluctuations in the causation of the seasonal variation, within the small number of years since his measurements had begun. However it is now understood that allowance should be made for about 50% absorption by the oceanic sinks. Keeling father and son have contributed to the work which has since yielded a much fuller understanding of the relation between atmospheric CO2 and the entirety of the carbon cycle, including the effects of land and ocean sinks.
On May 9, 2013, the daily mean concentration of carbon dioxide in the atmosphere measured at Mauna Loa surpassed 400 parts per million (ppm) for the first time since measurements began in 1958. Estimates of carbon dioxide during previous geologic eras suggest that CO2 has not been around this level for 2 to 4 million years, since the mid-Pliocene.
In 2015 the Keeling Curve was designated a National Historic Chemical Landmark by the American Chemical Society. Commemorative plaques are installed at the National Oceanic and Atmospheric Administration's Mauna Loa Observatory and the Scripps Institution of Oceanography at the University of California, San Diego.