
Type Public Phone +1 570-325-3691 Kindergartens 108 | School number (570) 325-3691 Faculty 153 Number of schools 3 | |
 | ||
School board 9 locally elected members Superintendent Mr Brian J Gasper, salary $110,000 (2014) (contract July 1, 2014 to June 30, 2019)former Barbara A. Conway, Ed D. (salary $97,544 2009) retired 2014 Administrator Lauren Kovac, Business ManagerTed LaRizzio, Director of Building & GroundsDustin McAndrew, Athletic DirectorBrian Baddick, Director of Special EducationKathy Doll, Coordinator of Academic ResourcesLauren Mundinger, Director of TransportationMolly Gallagher, Director of Food ServicesLori Lienhard, Director of Security Address 410 Center Ave, Jim Thorpe, PA 18229, USA | ||
Jim thorpe area school district top 8 facts
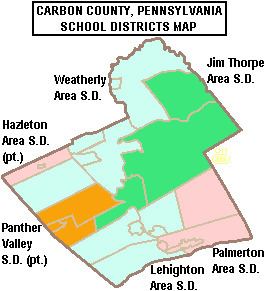
The Jim Thorpe Area School District is located in Carbon County, Pennsylvania in the United States of America. It comprises the borough of Jim Thorpe and the townships of Penn Forest and South Kidder. It covers a total area of 137 square miles (350 km2). According to 2000 federal census data, it serves a resident population of 11,428. By 2010, the District's population increased to 15,791 people. The educational attainment levels for the Jim Thorpe Area School District population (25 years old and over) were 87.8% high school graduates and 19.9% college graduates. The District is one of the 500 public school districts of Pennsylvania.
Contents
- Jim thorpe area school district top 8 facts
- Governance
- Teacher evaluation study
- Academic achievement
- District AYP status history
- Graduation rate
- High school
- AYP history
- College remediation rate
- SAT scores
- Morris Elementary School
- AYP History
- Special education
- Gifted education
- Budget
- State basic education funding
- Accountability Block Grants
- Ready to Learn grant
- PreK Counts grant
- Classrooms for the Future grant
- Other grants
- Federal grants
- Race to the Top grant
- Title II grants
- English language learners grant
- Common Cents state initiative
- Real estate taxes
- Act 1 Adjusted Index
- Property tax relief
- Wellness plan
- Extracurriculars
- Sports
- References
According to the Pennsylvania Budget and Policy Center, 48.9% of Jim Thorpe Area School District's pupils lived at 185% or below the Federal Poverty Level [1] as shown by their eligibility for the federal free or reduced price school meal programs in 2012. In 2013, the Pennsylvania Department of Education, reported that 19 students in the Jim Thorpe Area School District were homeless. In 2009, Jim Thorpe Area School District residents’ per capita income was $17,444, while the median family income was $42,637. In the Commonwealth, the median family income was $49,501 and the United States median family income was $49,445, in 2010. In Carbon County, the median household income was $48,900, lagging the median US income. By 2013, the median household income in the United States rose to $52,100. In 2014, the median household income in the USA was $53,700.
District officials reported in school year 2007-08, that Jim Thorpe Area School District (JTASD) provided basic educational services to 2,364 pupils. It employed: 161 teachers, 59 full-time and part-time support personnel, and 7 administrators. Jim Thorpe Area School District received more than $4.8 million in state funding in school year 2007-08. In 2011-12, the District enrollment was 2,430 pupils. It employed: 151 teachers, 138 full-time and part-time support personnel, and eleven (11) administrators. JTASD received $7,090,148 in state funding for the 2011-12 school year.
Jim Thorpe Area School District operates three schools: Lawrence B. Morris Elementary School (Preschool, full-day kindergarten - 8th); Penn Kidder Campus (preK - 8th) and Jim Thorpe Area High School (9th-12th). LB Morris is located in the town of Jim Thorpe. Penn Kidder Campus is located about 15 miles (24 km) from Jim Thorpe in the town of Albrightsville. High school students may choose to attend the Carbon Career & Technical Institute for training in the construction and mechanical trades. For the 2014-15 school year, 97 resident students chose to enroll in public, cyber charter schools, rather than attend the District's schools. The Carbon-Lehigh Intermediate units in Pennsylvania|Intermediate Unit]] IU21 provides the District with a wide variety of services like: specialized education for disabled students; state mandated training on recognizing and reporting child abuse; speech and visual disability services; criminal background check processing for prospective employees and professional development for staff and faculty.
Jim thorpe area school district top 8 facts
Governance
Jim Thorpe Area School District is governed by 9 individually elected board members (serve four-year terms), the Pennsylvania State Board of Education, the Pennsylvania Department of Education and the Pennsylvania General Assembly. The federal government controls programs it funds like Title I funding for low-income children in the Elementary and Secondary Education Act and the No Child Left Behind Act (renamed Every Student Succeeds Act (ESSA) in December 2015) which mandates the district focus its resources on student success in acquiring reading and math skills. The school board is required by state law to post a financial report on the district in its website by March of each school year.
The Superintendent and Business Manager are appointed by the school board. The Superintendent is the chief administrative officer with overall responsibility for all aspects of operations, including education and finance. The Business Manager is responsible for budget and financial operations. Neither of these officials are voting members of the School Board. The School Board enters into individual employment contracts for these positions. These contracts must be in writing and are subject to public discloure under the state’s Right to Know Act. In Pennsylvania, public school districts are required to give 150 days notice to the Superintendent and Business Manager regarding renewal of their employment contracts. Pursuant to Act 141 of 2012 which amended the Pennsylvania School Code, all school districts that have hired superintendents on/after the fall of 2012 are required to develop objective performance standards and post them on the district's website.
The Commonwealth Foundation for Public Policy Alternatives Sunshine Review gave the Jim Thorpe Area School Board and District Administration a "F" for transparency based on a review of "What information can people find on their school district's website". It examined the school district's website for information regarding; taxes, the current budget, meetings, school board members names and terms, contracts, audits, public records information and more.
Teacher evaluation study
In 2011, the district agreed to participate in a pilot program to develop a new way to evaluate teachers that, in part, takes into account student achievement. Several York County school districts are participating. The pilot program had 104 K-12 entities, including: nine career and technical centers, nine charter schools and nine intermediate units. Beginning in January 2012, participating school districts will use the new evaluation method and provide feedback to the Department of Education. This new evaluation will not be used to determine an educator’s official 2011-12 assessment. Under the new evaluation system, 50% of the evaluation of a teacher will be based on an observation divided into four categories: planning and preparation, classroom environment, instruction, and professional responsibilities. The other half will be based on student achievement (15 percent will be building-level data, 15 percent will be teacher-specific data, and 20 percent will be elective). The new evaluation system has both announced and unannounced observations. There are meetings between the teacher and evaluator before and after the direct observation of a lesson.
Academic achievement
In July 2012, the Pennsylvania Department of Education (PDE) released a report identifying Jim Thorpe Area School District schools as among the lowest-achieving schools for reading and mathematics in 2011. Jim Thorpe Area High School was among the 15% lowest-achieving schools in the Commonwealth. Parents and students may be eligible for scholarships to transfer to another public or nonpublic school through the state's Opportunity Scholarship Tax Credit Program passed in June 2012. The scholarships are limited to those students whose family's income is less than $60,000 annually, with another $12,000 allowed per dependent. Maximum scholarship award is $8,500, with special education students receiving up to $15,000 for a year's tuition. Parents pay any difference between the scholarship amount and the receiving school's tuition rate. Students may seek admission to neighboring public school districts. Each year the PDE publishes the tuition rate for each individual public school district. Fifty three public schools in Allegheny County are among the lowest-achieving schools in 2011. According to the report, parents in 414 public schools (74 school districts) were offered access to these scholarships. For the 2012-13 school year, eight public school districts in Pennsylvania had all of their schools placed on the list, including: Sto-Rox School District, Chester Upland School District, Clairton City School District, Duquesne City School District, Farrell Area School District, Wilkinsburg Borough School District, William Penn School District and Steelton-Highspire School District. Funding for the scholarships comes from donations by businesses which receive a state tax credit for donating.
In October 2015, Pennsylvania Auditor General Eugene DePasquale reported that L.B. Morris Elementary School was among the 561 academically challenged schools that have been overlooked by the Pennsylvania Department of Education. He also reported the Pennsylvania Department of Education failed to take any action to remediate the poorly performing schools to raise student academic achievement or to provide them with targeted professional assistance.
Jim Thorpe Area School District was ranked 272nd out of 493 Pennsylvania school districts by the Pittsburgh Business Times in 2016. The ranking was based on student academic achievement as demonstrated on the last three years of the PSSAs for: reading, writing math and science. The PSSAs are given to all children in grades 3rd through 8th and the 11th grade in high school. Writing exams were given to children in 5th and 8th grades. Adapted examinations are given to children in the special education programs. Some districts are not included in the ranking due to not operating a high school or where insufficient data was provided by the PDE..
In 2012, the Pittsburgh Business Times also reported an Overachievers Ranking for 498 Pennsylvania school districts. Jim Thorpe Area School District ranked 264th In 2011, the District was ranked 302nd in the Commonwealth. The editor describes the ranking as: "a ranking answers the question - which school districts do better than expectations based upon economics? This rank takes the Honor Roll rank and adds the percentage of students in the district eligible for free and reduced-price lunch into the formula. A district finishing high on this rank is smashing expectations, and any district above the median point is exceeding expectations."
District AYP status history
In 2011 and 2012, Jim Thorpe Area School District achieved Adequate Yearly Progress (AYP). In 2011, 94 percent of the 500 Pennsylvania public school districts achieved the No Child Left Behind Act progress level of 72% of students reading on grade level and 67% of students demonstrating on grade level math. In 2011, 46.9 percent of Pennsylvania school districts achieved Adequate Yearly Progress (AYP) based on student performance. An additional 37.8 percent of school districts made AYP based on a calculated method called safe harbor, 8.2 percent on the growth model and 0.8 percent on a two-year average performance. Jim Thorpe Area School District achieved AYP status each year from 2006 through 2010.
Graduation rate
In 2016, the graduation rate at Jim Thorpe Area School District was 88.79%.
High school
Jim Thorpe Area High School is located at 1 Olympian Way, Jim Thorpe. In 2016, enrollment had declined to 589 pupils in 9th through 12th grades, with 51.7% of pupils eligible for a free lunch due to the family meeting the federal federal poverty level. Additionally, 14.7% of pupils received special education services, while 4% of pupils were identified as gifted. Twenty five percent of the student populations is identified as belonging to a minority group. In 2015, the school employed 43 teachers. Per the PA Department of Education, 100% of the teachers were rated "Highly Qualified" under the federal No Child Left Behind Act. Jim Thorpe Area HIgh School is the sole high school operated by Jim Thorpe Area School District. The school hosts Lehigh Carbon Community College Carbon Center, a learning center (branch campus) within its building.
According to the National Center for Education Statistics, in 2010, the school reported an enrollment of 654 pupils in grades 7th through 12th, with 268 pupils eligible for a federal free or reduced-price lunch. The school employed 50 teachers, yielding a student–teacher ratio of 13:1. According to a report by the Pennsylvania Department of Education, 3 teachers were rated "Non‐Highly Qualified" under No Child Left Behind.
Achieved a SPP of 67.6 out of 100 points. Jim Thorpe Area High School Keystone Exams mandated testing results were: 86% of students were on grade level in reading literature and 71% of students demonstrated on grade level skills in Algebra I. In Biology I, 74.6% of pupils demonstrated on grade level science understanding at the end of the Biology course. The requirement that pupils pass the Keystone Exams in reading, algebra I and bIology I in order to graduate was postponed until 2019 by the Pennsylvania General Assembly because less than 60% of 12 grade pupils statewide would have been eligible for graduation from high school due to failing one or more Keystone Exams. Fifty-four percent of the 2,676 public schools in Pennsylvania achieved a passing score of 70 or better.
Jim Thorpe Area High School achieved 76 out of 100. Reflects on grade level reading, mathematics and science achievement. The PDE reported that 88% of the High School’s students were on grade level in reading/literature. In Algebra 1, 81% of students showed on grade level skills at the end of the course. In Biology I, 71.5% demonstrated on grade level science understanding at the end of the course. Statewide, 53 percent of schools with an eleventh grade achieved an academic score of 70 or better. Five percent of the 2,033 schools with 11th grade were scored at 90 and above; 20 percent were scored between 80 and 89; 28 percent between 70 and 79; 25 percent between 60 and 69 and 22 percent below 60. The Keystone Exam results showed: 73 percent of students statewide scored at grade-level in English, 64 percent in Algebra I and 59 percent in biology.
Jim Thorpe Area High School achieved 88.2 out of 100. Reflects on grade level reading, mathematics and science achievement. In reading/literature, 88% were on grade level. In Algebra 1, 76% showed on grade level skills. In Biology, 71% demonstrated on grade level science understanding at the end of the course. Statewide, the percentage of high school students who scored proficient and advanced in Algebra I increased to 39.7% to 40.1%. The percentage of high school students who scored proficient and advanced in reading/literature declined to 52.5%. The percentage of high school students who scored proficient and advanced in biology improved from 39.7% to 41.4%.
Jim Thorpe Area High School achieved 89.8 out of 100. Reflects on grade level reading, mathematics and science achievement. In reading/literature, 91.54% were on grade level. In Algebra 1, 80.7% showed on grade level skills. In Biology, just 59% showed on grade level science understanding. According to the Pennsylvania Department of Education, 2,181 public schools (less than 73 percent of Pennsylvania public schools), achieved an academic score of 70 or higher. Pennsylvania 11th grade students no longer take the PSSAs. Instead, beginning in 2012, they take the Keystone Exams at the end of the associated course.
AYP history
In 2012, Jim Thorpe Area High School achieved Adequate Yearly Progress (AYP) status, through exceptions. In 2011, Jim Thorpe Area High School was in Warning AYP status. The school achieved just one of 6 academic metrics measured.
Pennsylvania System of School Assessments, commonly called PSSAs are No Child Left Behind Act related examinations which were administered from 2003 through 2012, in all Pennsylvania public high schools. The exams were administered in the Spring of each school year. The goal was for 100% of students to be on grade level or better in reading and mathematics, by the Spring of 2014. The tests focused on the state's Academic Standards for reading, writing, mathematics and science. The Science exam included content in science, technology, ecology and the environmental studies. The mathematics exam included: algebra I, algebra II, geometry and trigonometry. The standards were first published in 1998 and are mandated by the Pennsylvania State Board of Education.
In 2013, the Commonwealth of Pennsylvania changed its high school assessments to the Keystone Exams in Algebra 1, Reading/literature and Biology1. The exams are given at the end of the applicable course, rather than all in the spring of the student's 11th grade year. The state announced the change in 2010 and made it in order to comply with Governor Edward G. Rendell's agreement to change to the national Common Core standards.
College remediation rate
According to a Pennsylvania Department of Education study released in January 2009, 31% of the Jim Thorpe Area High School graduates required remediation in mathematics and or reading before they were prepared to take college level courses in the Pennsylvania State System of Higher Education or community colleges. Less than 66% of Pennsylvania high school graduates, who enroll in a four-year college in Pennsylvania, will earn a bachelor's degree within six years. Among Pennsylvania high school graduates pursuing an associate degree, only one in three graduate in three years. Per the Pennsylvania Department of Education, one in three recent high school graduates who attend Pennsylvania's public universities and community colleges takes at least one remedial course in math, reading or English.
SAT scores
In 2015, 65 Jim Thorpe Area School District students took the SAT exams. The District's Verbal Average Score was 512. The Math average score was 521. The Writing average score was 474. The College Board also reported that statewide 96,826 pupils took the exams with average scores declining in all three measurers to: 495 in reading, 511 in math and 484 in writing.
In 2014, 95 Jim Thorpe Area School District students took the SAT exams. The District's Verbal Average Score was 477. The Math average score was 477. The Writing average score was 464. Statewide in Pennsylvania, Verbal Average Score was 497. The Math average score was 504. The Writing average score was 480. The College Board reported that nationwide scores were: 497 in reading, 513 in math and 487 in writing. In 2014, 1,672,395 students took the SATs in the United States.
In 2013, 85 Jim Thorpe Area School District students took the SAT exams. The District's Verbal Average Score was 479. The Math average score was 486. The Writing average score was 461. The College Board reported that statewide scores were: 494 in reading, 504 in math and 482 in writing. The nationwide SAT results were the same as in 2012.
In 2012, 76 Jim Thorpe Area School District students took the SAT exams. The District's Verbal Average Score was 457. The Math average score was 466. The Writing average score was 458. The statewide Verbal SAT exams results were: Verbal 491, Math 501, Writing 480. In the USA, 1.65 million students took the exams achieving scores: Verbal 496, Math 514, Writing 488. According to the College Board the maximum score on each section was 800, and 360 students nationwide scored a perfect 2,400.
In 2011, 86 Jim Thorpe Area School District students took the SAT exams. The District's Verbal Average Score was 471. The Math average score was 464. The Writing average score was 449. Pennsylvania ranked 40th among states with SAT scores: Verbal - 493, Math - 501, Writing - 479.
The Center for Rural Pennsylvania, a research arm of the Pennsylvania General Assembly, compared the SAT data of students in rural areas of Pennsylvania to students in urban areas. From 2003 to 2005, the average total SAT score for students in rural Pennsylvania was 992, while urban students averaged 1,006. During the same period, 28 percent of 11th and 12th graders in rural school districts took the exam, compared to 32 percent of urban students in the same grades. The average math and verbal scores were 495 and 497, respectively, for rural students, while urban test-takers averaged 499 and 507, respectively. Pennsylvania’s SAT composite score ranked low on the national scale in 2004. The composite SAT score of 1,003 left Pennsylvania ranking 44 out of the 50 states and Washington, DC.
Morris Elementary School
Lawrence B. Morris Elementary School is located at 150 W 10th Street, Jim Thorpe. In 2016, enrollment was 759 pupils, preschool through 8th, with 49.8% of pupils eligible for a free lunch due to family poverty. Additionally, 16.6% of pupils received special education services, while less than 0.5% of pupils were identified as gifted. According to a 2014 report by the Pennsylvania Department of Education, 100% of its teachers were rated "Highly Qualified" under No Child Left Behind. The school is a federally designated Title I school. The school provides full day kindergarten since 2003 and operates a preschool which is located in the high building. The first cohort of children who attended Accountability Block Grant funded full-day kindergarten reached third grade and took the PSSAs in the spring of 2008. The school serves children who live in the town of Jim Thorpe and those living south of the Pennsylvania Turnpike.
According to the National Center for Education Statistics, in 2013, L. B. Morris Elementary School reported an enrollment of 751 pupils, in grades preschool through 8th, with 371 pupils receiving a federal free or reduced price lunch due to family poverty. The school employed 49 teachers yielding a student-teacher ratio of 15:1. According to a report by the Pennsylvania Department of Education, 100% of teachers were rated "Highly Qualified" under No Child Left Behind.
SPP 61.1 out of 100 points. L. B. Morris Elementary School PSSA mandated testing results were: 47% of students in 8th grade were on grade level in reading, while just 14% of students demonstrated on grade level in mathematics. In science, only 53% of eighth grade pupils demonstrated on grade level science understanding. In 7th grade, 57% of pupils were on grade level in reading, while just 25% demonstrated on grade level math skills. Among 6th graders, 55% were on grade level in reading and only 17% were on grade level in math. In 2016, 52% of 5th grade students were on grade level in reading. In mathematics, just 30% of 5th grade students showed on grade level math skills. No fifth grade writing scores were reported. In 4th grade, 54% were on grade level in reading, while 31% demonstrated on grade level math skills. In science, 76% of fourth grade pupils demonstrated on grade level understanding of science concepts in the state standards. Among the school's third graders, 62% were on grade level in reading and 44% showed on grade level mathematics skills. Statewide just 31% of eighth graders demonstrated on grade level in math and 58% of eighth graders were on grade level in reading. In science, 57.7% of eighth graders showed on grade level proficiency. Among 7th graders, just 37% of students demonstrated on grade evel skills in mathematics. In seventh grade reading, 58% were on grade level. Sixth graders had 61.5% showing on grade level math skills. In reading, 61.5% of sixth graders were on grade level.
The PDE withheld SPP scores. It was reported that just 50% of 8th grade students at L. B.Morris Elementary School students were on grade level in reading on the PSSAs given in April 2015. In math/Algebra 1, only 13% of 8th grade students showed on grade level skills. In science, 69% of the school’s 8th graders demonstrated on grade level science understanding. No eighth grade writing scores were reported. In 7th grade, just 39% were on grade level in reading, while only 12% showed on grade level math skills. Among 6th graders, 60% were on grade level in reading and 34% were on grade level in mathematics. Among fifth graders, 58% of 5th grade students were on grade level in reading. In mathematics, 25% of 5th grade students showed on grade level skills. No fifth grade writing scores were reported. In 4th grade, 60% were on grade level in reading, while 41% showed on grade level math skills. In science, 78% of fourth graders showed on grade level understanding. Among third (3rd) graders, just 61% were on grade level in reading and 43% were on grade level in mathematics. Statewide 58% of eighth (8th) graders were on grade level in reading, while 29% demonstrated on grade level math skills. Pennsylvania 7th graders were 58% on grade level in reading and 33% demonstrated on grade level math skills. Among sixth (6th) graders, 60.7% were reading on grade level, while 39.7% demonstrated on grade level math skills. Statewide 61.9% of fifth (5th) graders were on grade level in reading, while 42.8% demonstrated on grade level math skills.
L. B. Morris Elementary School achieved 69 out of 100. Reflects on grade level reading, mathematics and science achievement. In reading/literature, 72% of pupils were on grade level (3rd through 8th grades). Among 3rd graders, just 71% were reading on grade level. In Algebra 1/Math, 75% of pupils (3rd-8th) showed on grade level mathematics skills. In Science, 74.8% of 4th and 8th graders showed on grade level science understanding. In writing, 56.9% of the 5th and 8th grade students demonstrated on grade level writing skills.
L. B. Morris Elementary School achieved 81.8 out of 100. Reflects on grade level reading, writing, mathematics and science achievement. In reading, 75% of the students were on grade level. In 3rd grade 79% of pupils were reading on grade level. In Mathematics/Algebra 1, 79% of the students (3rd-8th) showed on grade level skills. In Science, 79% of the 4th and 8th graders demonstrated on grade level understanding. In writing, 77% of the 5th and 8th grade students demonstrated on grade level writing skills. According to the Pennsylvania Department of Education, 2,181 public schools (less than 73 percent of Pennsylvania public schools), achieved an academic score of 70 or higher.
AYP History
In 2012, L.B. Morris Elementary School achieved Adequate Yearly Progress (AYP) status, through multiple special exemptions. In 2011, the School also achieved AYP status in a similar exemption plan.
The 3rd graders take the PSSAs in math and reading. The fourth grade is tested in reading, math and science. The fifth grade is evaluated in reading, mathematics and writing. Sixth and seventh grades have been tested in reading and mathematics since 2006. Eighth graders are tested in: reading, writing, mathematics and science. Beginning in the Spring of 2013, eighth graders, who are enrolled in Algebra I take the Keystone Exam for Algebra I at the end of the course. The testing of 8th grade in reading and mathematics began in 1999, as a state initiative. Testing in science began in 2007. The goal is for 100% of students to be on grade level or better in reading and mathematics, by the Spring of 2014. The tests focus on the state's Academic Standards for reading, writing, mathematics and science. The standards were published in 1998 and are mandated by the Pennsylvania State Board of Education. In 2014, the Commonwealth of Pennsylvania adopted the Pennsylvania Core Standards - Mathematics.
Special education
In December 2015, Jim Thorpe Area School District administration reported that 359 pupils or 16.6% of the district's pupils received Special Education services, with 47% of the identified students having a specific learning disability. In 2010, Jim Thorpe Area School District administration reported that 409 pupils or 17.6% of the district's pupils received Special Education services, with 56.7% of the identified students having a specific learning disability. In 2007, Jim Thorpe Area School District administration reported that 419 pupils or 19.9% of the district's pupils received Special Education services, with 58.5% of the identified students having a specific learning disability. Special education services in the Commonwealth are provided to students from ages three years to 21 years old. In the 2010-2011 school year, the total student enrollment was more than 1.78 million students with approximately 275,000 students eligible for special education services. Among these students 18,959 were identified with mental retardation and 21,245 students with autism. The largest group of students are identified as Specific Learning Disabilities 126,026 students (46.9 percent) and Speech or Language Impairments with 43,542 students (16.2 percent).
In 2007, Pennsylvania Secretary of Education Gerald Zahorchak testified before the Pennsylvania House Education Committee regarding full day kindergarten. He claimed that districts which offered the program would see a significant decrease in special education students due to early identification and early intervention. He asserted the high cost of full day kindergarten would be recouped by Districts in lower special education costs. Jim Thorpe Area School District has provided full day kindergarten since 2003. The District has seen a slight decrease in the percentage of special education students it serves, however this has yielded no savings.
In order to comply with state and federal Individuals with Disabilities Education Act rules and regulations, the school district engages in identification procedures to ensure that eligible students receive an appropriate educational program consisting of special education and related services, individualized to meet student needs. At no cost to the parents, these services are provided in compliance with state and federal law; and are reasonably calculated to yield meaningful educational benefit and student progress. To identify students who may be eligible for special education services, various screening activities are conducted on an ongoing basis. These screening activities include: review of group-based data (cumulative records, enrollment records, health records, report cards, ability and achievement test scores); hearing, vision, motor, and speech/language screening; and review by the Special Education administration. When screening results suggest that the student may be eligible, the District seeks parental consent to conduct a multidisciplinary evaluation. Parents who suspect their child is eligible may verbally request a multidisciplinary evaluation from a professional employee of the District or contact the district's Special Education Department. By Pennsylvania law, the District has 60 calendar days, after receiving parental consent, to complete the evaluation. The IDEA 2004 requires each school entity to publish a notice to parents, in newspapers or other media, including the student handbook and school website regarding the availability of screening and intervention services and how to access them.
Students who have an Individual Education Plan (IEP) may take the PSSA-M an alternative math exam rather than the PSSA. Some special education students may take the PASA (Pennsylvania Alternate System of Assessment), rather than the PSSA. Schools are permitted to provide accommodations to some students.
In 2010, the state of Pennsylvania provided $1,026,815,000 for Special Education services. This funding was in addition to the state's basic education per pupil funding, as well as, all other state and federal funding. The Special Education funding structure is through the federal Individuals with Disabilities Education Act (IDEA) funds and state appropriations. IDEA funds are appropriated to the state on an annual basis and distributed through intermediate units (IUs) to school districts, while state funds are distributed directly to the districts. Total funds that are received by school districts are calculated through a formula. The Pennsylvania Department of Education oversees four appropriations used to fund students with special needs: Special Education; Approved Private Schools; Pennsylvania Chartered Schools for the Deaf and Blind; and Early Intervention. The Pennsylvania Special Education funding system assumes that 16% of the district's students receive special education services. It also assumes that each student’s needs accrue the same level of costs. Over identification of students, in order to increase state funding, has been an issue in the Commonwealth. Some districts have more than 20% of its students receiving special education services while others have 10% supported through special education. The state requires each public school district and charter school to have a three-year special education plan to meet the unique needs of its special education students. In 2012, the Obama Administration's US Department of Education issued a directive requiring schools include students with disabilities in extracurricular activities, including sports.
Jim Thorpe Area School District received a $770,714 supplement for special education services in 2010. For the 2011-12, 2012–13 and 2013-14 school years, all Pennsylvania public school districts received the same level of funding for special education that they received in 2010-11. This level funding was provided regardless of changes in the number of pupils who need special education services and regardless of the level of services the respective students required.
Additionally, the state provides supplemental funding for extraordinarily impacted students. The District must apply for this added funding. In 2013, the state's Special Education Funding Reform Commission provided a report on the state of funding for special education in the Commonwealth. Funding for special education programs is borne largely on a local basis at 60%, with the state contributing $1 billion or 30% and the federal government providing 10% of the funding.
Gifted education
Jim Thorpe Area School District Administration reported that 79 or 3.61% of its students were gifted in 2009. This was the highest percentage of gifted children in a Carbon County public school district. The highest percentage of gifted students reported among all 500 school districts and 100 public charter schools in Pennsylvania was North Allegheny School District with 15.5% of its students identified as gifted. By law, the district must provide mentally gifted programs at all grade levels. The referral process for a gifted evaluation can be initiated by teachers or parents by contacting the student’s building principal and requesting an evaluation. All requests must be made in writing. To be eligible for mentally gifted programs in Pennsylvania, a student must have a cognitive ability of at least 130 as measured on a standardized ability test by a certified school psychologist. Other factors that indicate giftedness are also be considered for eligibility.
Budget
Pennsylvania public school districts budget and expend funds according to procedures mandated by the General Assembly and the Pennsylvania Department of Education (PDE). An annual operating budget is prepared by school district administrative officials. A uniform form is furnished by the PDE and submitted to the board of school directors for approval prior to the beginning of each fiscal year on July 1.
Under Pennsylvania’s Taxpayer Relief Act 1 of the Special Session of 2006, all school districts of the first class, second class, third class and fourth class must adopt a preliminary budget proposal. Jim Thorpe Area is a district of the third class. The proposal must include estimated revenues and expenditures and the proposed tax rates. This proposed budget must be considered by the Board no later than 90 days prior to the date of the election immediately preceding the fiscal year. The preliminary budget proposal must also be printed and made available for public inspection at least 20 days prior to its adoption. The board of school directors may hold a public hearing on the budget, but are not required to do so. The board must give at least 10 days’ public notice of its intent to adopt the final budget according to Act 1 of 2006.
In 2015, the average teacher salary in Jim Thorpe Area School District was $59,408 a year with 170 teachers employed. In 2013, the average teacher salary in Jim Thorpe Area School District was $59,996 a year. The District employed 163 teachers with a top salary of $108,737. Pennsylvania teacher salaries (2013–14) are searchable in a statewide database provided by The Citizen's Voice news site. Jim Thorpe Area School District teacher and administrator retirement benefits are equal to at least 2.00% x Final Average Salary x Total Credited Service. (Some teachers benefits utilize a 2.50% benefit factor.) After 40 years of service, Pennsylvania public school teachers and administrators can retire with 100% of the average salary of their final 3 years of employment. According to a study conducted at the American Enterprise Institute, in 2011, public school teachers’ total compensation is roughly 50 percent higher than they would likely receive in the private sector. The study found that the most generous benefits that teachers receive are not accounted for in many studies of compensation including: pension, retiree health benefits and job security. In 2014-15, the state mandated District contribution to the teacher pension fund rose to 21.40% of employee salaries and in 2015-16 it rose again to 25.84% of total District salaries. By 2016-17, the district's contribution was 30% of each employee's salary.
In 2009, Jim Thorpe Area School District reported employing 175 teachers and administrators with a median salary of $51,598 and a top salary of $97,544. The teacher’s work day is 7.5 hours with 186 days in the contract year. The teachers receive a defined benefit pension, health insurance, dental insurance, vision insurance, an income protection plan, professional development reimbursement of 100%, 2 paid personal days, 2 paid emergency leave days, 12 paid sick days, and other benefits. Teachers receive a $10,000 cash retirement bonus after 30 years of teaching with just 15 years at JTASD. As of 2007, Pennsylvania ranked in the top 10 states in average teacher salaries. When adjusted for cost of living Pennsylvania ranked fourth in the nation for teacher compensation.
Jim Thorpe Area School District administrative costs per pupil in 2008 was $792.18 per pupil. The lowest administrative cost per pupil in Pennsylvania was $398 per pupil. The Pennsylvania School Boards Association collects and maintains statistics on salaries of public school district employees in Pennsylvania. Superintendents and administrators receive a benefit package commensurate with that offered to the district's teachers' union.
In 2008, Jim Thorpe Area School District administration reported that per pupil spending was $13,059 which ranked 207th among Pennsylvania's then 501 public school districts. In 2010, the District's per pupil spending had increased to $14,727.26. In 2013, the per pupil spending was reported as $16,867.68 which ranked 100th among PA school districts. In 2011, Pennsylvania’s per pupil spending was $13,467, ranking 6th in the United States. In 2007, the Pennsylvania per pupil total expenditures was reported as $12,759.
Reserves In 2008, Jim Thorpe Area School District reported a fund balance of $2,120,455. In 2012, Jim Thorpe Area School District Administration reported an increase to $1,925,000 in the unreserved-undesignated fund balance, with a total reserves of $8,647,815. In 2014-15, Jim Thorp Area School District reported having $$7,988,199 in reserves.
Pennsylvania public school district reserve funds are divided into two categories – designated and undesignated. The undesignated funds are not committed to any planned project. Designated funds and any other funds, such as capital reserves, are allocated to specific projects. School districts are required by state law to keep 5 percent of their annual spending in the undesignated reserve funds to preserve bond ratings. According to the Pennsylvania Department of Education, from 2003 to 2010, as a whole, Pennsylvania school districts amassed nearly $3 billion in reserved funds. In 2005, the total reserve funds held by Pennsylvania public school districts was $1.9 billion. By 2013, reserves held by Pennsylvania public school districts, as a whole, had increased to over $3.8 billion.
Tuition Students who live in the Jim Thorpe Area School District's attendance area may choose to attend one of Pennsylvania's 157 public charter schools. A student living in a neighboring public school district or a foreign exchange student may seek admission to Area School District. For these cases, the Pennsylvania Department of Education sets an annual tuition rate for each school district. It is the amount the public school district pays to a charter school for each resident student that attends the charter and it is the amount a nonresident student's parents must pay to attend the District's schools. The 2013 tuition rates were Elementary School - $9,606.90, High School - $9,037.48. In 2015, the tuition rates were Elementary School - $11,483.03, High School - $10,274.55.
The Jim Thorpe Area School District is funded by a combination of: a local earned income tax 0.5%, a property tax, a real estate transfer tax 0.5%, coupled with substantial funding from the Commonwealth of Pennsylvania and a small amount, generally 10% of its budget from the federal government. Grants can provide an opportunity to supplement school funding without raising local taxes. Interest earnings on accounts also provide nontax income to the District. In the Commonwealth of Pennsylvania, pension income and Social Security income are exempted from state personal income tax and local earned income tax, regardless of the level of the individual’s personal wealth. The average Pennsylvania public school teacher pension in 2011 exceeded $60,000 a year, plus they receive federal Social Security benefits. Both retirement benefits are free of Pennsylvania state income tax and local income tax which funds local public schools. Effective 2016, active duty military are also exempted from paying the local earned income tax in Pennsylvania.
State basic education funding
According to a report from Representative Todd Stephens office, Jim Thorpe Area School District receives just 18.2% of its annual revenue from the state. In December 2014, the Pennsylvania Education Funding Reform Commission conducted a hearing. The commission developed a new basic education funding formula which sets a new way to distribute state basic education dollars. It abolished the practice of "hold harmless" funding, which gave districts at least the same as they got the previous school year regardless of declining enrollment. The plan became law in June 2016 (House Bill 1552).
For the 2016-17 school year, Jim Thorpe Area School District received $3,280,324 in Basic Education Funding from the Commonwealth of Pennsylvania. This is a 10.6% increase over 2015-16 funding to the District yielding $314,097 more for the District. It was the highest percentage of BEF increase in Carbon County under the state’s Basic Education Funding formula. For the 2016-17 school year, Pennsylvania increased its public education spending to a record high of $5,895 billion. It was a $200 million increase, 3.51% increase over the 2015-16 appropriation. The state also funded Ready to Learn grants at $250 million and Special Education funding received a $20 million increase. The state also paid $492 million to the school employee social security fund and another $2.064 billion to the teacher’s pension fund. Statewide Conestoga Valley School District received a 13.3% increase in state BEF funding. Five PA public school districts received an increase of 10% or greater in Basic Education funding over their 2015-16 funding.
For the 2015-16 school year, Governor Tom Wolf released a partial Basic Education Funding of $1,452,981 to Jim Thorpe Area School District, in January 2016. This was part of $10.3 billion in school funding withheld from the public schools, by the Governor since the summer of 2015. The dispersement did not follow the new Basic Education Fair Funding formula which had been established by the Pennsylvania General Assembly in June 2015. Ten (10) Pennsylvania school districts received no increase in Basic Education funding under Governor Wolf's plan.
In compliance with a legislative mandate that was passed with veto proof majorities in the PA House and Senate, the final BEF funding was determined for 2015-16, in April 2016. Jim Thorpe Area School District received $2,966,227 in Basic Education Funds for the 2015-16 school year. This was a 8.68% increase yielding a $236,989 increase over the previous school year funding. The District also received $166,793 in Ready to Learn funding from the state.
For the 2014-15 school year, Jim Thorpe Area School District received $2,728,037 in State Basic Education funding. The District also received $166,793 in new Ready To Learn Block grant. The State’s enacted Education Budget included $5,526,129,000 for the 2014-2015 Basic Education Funding. The Education budget also included Accountability Block Grant funding at $100 million and $241 million in new Ready to Learn funding for public schools that focus on student achievement and academic success. The State paid $500.8 million to Social Security on the school employees behalf and another $1.16 billion to the state teachers pension system (PSERS). In total, Pennsylvania’s Education budget for K-12 public schools is $10 billion. This was a $305 million increase over 2013-2014 state spending and the greatest amount ever allotted by the Commonwealth for its public schools.
In the 2013-14 school year, Jim Thorpe Area School District received a 4% increase or $2,730,241 in Pennsylvania Basic Education Funding. This is $104,399 more than its 2012-13 state BEF to the District. Additionally, Jim Thorpe Area School District received $69,026 in Accountability Block Grant funding to focus on academic achievement and level funding for special education services. Among the public school districts in Carbon County, Jim Thorpe Area School District received the highest percentage increase in BEF. The District had the option of applying for several other state and federal grants to increase revenues. The Commonwealth’s budget increased Basic Education Funding statewide by $123 million to over $5.5 billion. Most of Pennsylvania’s 500 public school districts received an increase of Basic Education Funding in a range of 0.9% to 4%. Eight public school districts received exceptionally high funding increases of 10% to 16%. The highest increase in state funding was awarded to Austin Area School District which received a 22.5% increase in Basic Education Funding. The highest percent of state spending per student is in the Chester-Upland School District, where roughly 78 percent comes from state coffers. In Philadelphia, it is nearly 49 percent. As a part of the education budget, the state provided the PSERS (Pennsylvania school employee pension fund) with $1,017,000,000 and Social Security payments for school employees of $495 million.
For the 2012-13 school year, Jim Thorpe Area School District received $2,625,839.00. The Governor's Executive Budget for 2012-13 included $9.34 billion for kindergarten through 12th grade public education, including $5.4 billion in basic education funding, which was an increase of $49 million over the 2011-12 budget. In addition, the Commonwealth provided $100 million for the Accountability Block Grant (ABG) program. Jim Thorpe Area received $69,026 in ABG funds. The state also provided a $544.4 million payment for School Employees’ Social Security and $856 million for School Employees’ Retirement fund called PSERS. This amount was a $21,823,000 increase (0.34%) over the 2011-2012 appropriations for Basic Education Funding, School Employees' Social Security, Pupil Transportation, Nonpublic and Charter School Pupil Transportation. Since taking office, Corbett’s first two budgets have restored more than $918 million in support of public schools, compensating for the $1 billion in federal stimulus dollars lost at the end of the 2010-11 school year. The District reported 977 pupils received a free or reduced price lunch.
In 2011-12 school year, Jim Thorpe Area School District received a 4.24% increase in BEF, yielding a $2,624,079 allocation, of state Basic Education Funding. Additionally, the Jim Thorpe Area School District received $69,026 in Accountability Block Grant funding. The enacted Pennsylvania state Education budget included $5,354,629,000 for the 2011-2012 Basic Education Funding appropriation. This amount was a $233,290,000 increase (4.6%) over the enacted State appropriation for 2010-2011. The highest increase in state basic education funding was awarded to Duquesne City School District of Allegheny County, which got a 49% increase in state funding for 2011-12. In 2010, the district reported that 975 students received free or reduced price lunches, due to the family meeting the federal poverty level. Some Pennsylvania public school districts experienced a reduction of total funding due to the termination of federal stimulus funding, by the Barack Obama administration, which ended in 2011.
In the 2010-11 budget year, the Commonwealth of Pennsylvania provided a 11.05% increase in Basic Education Funding for a total of $2,825,248 . Among the districts in Carbon County, the highest increase went to Jim Thorpe Area School District. One hundred fifty Pennsylvania school districts received the base 2% increase. The highest increase in 2010-11 went to Kennett Consolidated School District in Chester County, which received a 23.65% increase in state funding. Fifteen (15) Pennsylvania public school districts received a BEF increase of greater than 10%. The state's hold harmless policy regarding state basic education funding continued where each district received at least the same amount as it received the prior school year, even when enrollment had significantly declined. The amount of increase each school district received was set by Governor Edward Rendell and then Secretary of Education Gerald Zahorchak, as a part of the state budget proposal given each February. This was the second year of Governor Rendell’s policy to fund some public school districts at a far greater rate than others.
In the 2009-10 budget year, the Commonwealth of Pennsylvania provided a 9.4% increase in Basic Education Funding for a total of $2,544,059. Among the districts in Carbon County, the highest increase went to Panther Valley School District which got a 14.06%. Ninety (90) Pennsylvania public school districts received the base 2% increase. Muhlenberg School District in Berks County received a 22.31% increase in state basic education funding in 2009. The amount of increase each school district received was set by Governor Edward G. Rendell and the Secretary of Education Gerald Zahorchak, as a part of their state budget proposal.
The state Basic Education Funding to the District in 2008-09 was $2,325,419.72. According to the Pennsylvania Department of Education, 732 district students received free or reduced- price lunches due to low family income in the 2007–2008 school year. According to the U.S. Census Bureau, Pennsylvania spent $7,824 Per Pupil in the year 2000. This amount increased up to $12,085 by the year 2008.
All Pennsylvania school districts also receive additional funding from the state through several funding allocations, including: Reimbursement of Charter School Expenditures; Special Education Funding; Secondary Career & Technical Education Subsidy; PA Accountability Grants; and low achieving schools were eligible for Educational Assistance Program Funding. Plus all Pennsylvania school districts receive federal dollars for various programs including: Special Education funding and Title I funding for children from low income families. In 2010, Pennsylvania spent over $24 billion for public education - local, state and federal dollars combined. By 2015, Pennsylvania was spending over $27 billion on public education (local, state and federal resources combined).
The U.S. Census Bureau reported that Pennsylvania spent $8,191 per pupil in school year 2000-01. In 2007, the Pennsylvania per pupil total expenditures was reported as $12,759. Among the fifty states, Pennsylvania’s total per pupil revenue (including all sources) ranked 11th at $15,023 per student, in 2008-09. Pennsylvania’s total revenue per pupil rose to $16,186 ranking 9th in the nation in 2011.
Accountability Block Grants
Beginning in 2004-05, the state launched the Accountability Block Grant school funding. This program has provided $1.5 billion to Pennsylvania’s school districts. The Accountability Block Grant program requires that its taxpayer dollars are focused on specific interventions that are most likely to increase student academic achievement. These interventions include: teacher skills training; All Day Kindergarten; lower class size in Kindergarten through 3rd grade; literacy and math coaching programs (provides teachers with individualized job-embedded professional development to improve their instruction); before or after school tutoring assistance to struggling students. For 2010-11, the District applied for and received $187,354 in addition to all other state and federal funding. The District used the funding to provide full-day kindergarten and increase instructional time. In 2009, 100% of the kindergarteners in Jim Thorpe Area School District attended full-day kindergarten.
In 2011-2012 and 2012-2013, the District received $69,026.
Ready to Learn grant
Beginning in the 2014-2015 budget, the State funded a new Ready to Learn Grant for public schools. A total of $100 million is allocated through a formula to districts based on the number of students, level of poverty of community as calculated by its market value/personal income aid ratio (MV/PI AR) and the number of English language learners. Ready to Learn Block Grant funds may be used by the Districts for: school safety; Ready by 3 early childhood intervention programs; individualized learning programs; and science, technology, engineering and math (STEM) programs.
Jim Thorpe Area School District received $97,767 in Ready to Learn Grant dollars in addition to State Basic Education funding, Special Education funding, PreK Counts funding, transportation reimbursement, reimbursement for Social Security payments for employees and other state grants which the district must apply to receive.
PreK Counts grant
Jim Thorpe Area School District receives state funding to provide taxpayer funded preschool at the elementary schools. For the 2013-14 school year, Jim Thorpe Area School District received a Pre K Counts grant of $145,200. For the 2011 school year, Jim Thorpe Area School District was not a high priority for funding due to the 33% poverty level of children in the district's attendance area. The District received 150,100 in PreK Counts funds in 2011. Enrollment for Pennsylvania Pre-K Counts is targeted to children living in families earning up to 300 percent of the federal poverty level.
In 2013, the state’s PreK Counts program received $87,284,000. In 2010, the PreK Counts program received $83.6 million statewide in Governor Corbett’s education budget. In 2007-08 the state funded Pre-K Counts at $75 million. Jim Thorpe Area School District received funding in 2007-08. In 2009-10, the District received $158,000 to provide preschool to 41 children.
Classrooms for the Future grant
The Classroom for the Future state program provided districts with hundreds of thousands of extra state funding to buy laptop computers for each core curriculum high school class (English, Science, History, Math) and paid for teacher training to optimize the computers use. The program was funded from 2006 to 2009. The Jim Thorpe Area School District did not apply to participate in 2006-07. In 2007-08, Jim Thorpe Area receive $212,981. The district also received another $45,413 in 2008-09 for a total funding of $258,394. Among the public school districts in Carbon County, the highest award was given to Jim Thorpe Area School District. The highest funding statewide was awarded to Philadelphia City School District in Philadelphia County - $9,409,073. The grant program was discontinued by Governor Edward Rendell as part of the 2009-10 state budget.
Other grants
Jim Thorpe Area School District did not participate in: Pennsylvania Department of Environmental Protection's Environmental Education annual grants; PA Science Its Elementary grants (discontinued effective with 2009-10 budget by Governor Rendell); Education Assistance Grants; 2012 Striving Readers Comprehensive Literacy grant; 2013 Safe Schools and Resource Officer grants; 2012 and 2013 Pennsylvania Hybrid Learning Grants; Project 720 High School Reform grants (discontinued effective with 2011-12 budget); nor the federal 21st Century Learning grants.
Federal grants
Jim Thorpe Area School District received an extra $621,666 in American Recovery and Reinvestment Act of 2009 (ARRA) - Federal Stimulus money to be used in specific programs like special education and meeting the academic needs of low-income students. The funding was limited to the 2009-2010 and 2010-2011 school years. Due to the temporary nature of the funding, schools were repeatedly advised by the Pennsylvania Department of Education, the Pennsylvania Senate Education Committee, Governor Edward Rendell and the Pennsylvania School Board Association, to use the funds for one-time expenditures like acquiring equipment, making repairs to buildings, training teachers to provide more effective instruction or purchasing books and software.
Race to the Top grant
Jim Thorpe Area School District officials applied for the federal Race to the Top grant which would have provided over one-half million dollars, in additional federal funding, to improve student academic achievement. Participation required the administration, the school board and the local teachers' union to sign an agreement to prioritize improving student academic success. In Pennsylvania, 120 public school districts and 56 charter schools agreed to participate. Pennsylvania was not approved for the grant. The failure of districts to agree to participate was cited as one reason that Pennsylvania was not approved.
Title II grants
The Federal government provides annual grants to schools to be used to improve the quality of teacher instructions to pupils. The goal is to provide each child in public schools with “High Quality” teachers and principals as defined by the state. The funds are sent to the state Department of Education which distributes them to each school district and charter school. Beginning in 2002, the federal funding committed to Title II was $3,175,000,000.
Public school district administrations must apply to the state annually for the Title II funds. In 2012-13, Jim Thorpe Area School District received $70,341 in federal Title II funding. In 2014-15, Jim Thorpe Area School District applied for and received $66,004.
English language learners grant
The Federal government provides annual grants to schools to assist in educating immigrant children and children who are identified as limited English proficient. Upon registering for school a language survey is done for all new enrollment pupils, typically in kindergarten or preschool. They identify the primary language spoken at home. This data is collected and submitted to the Pennsylvania Department of Education, which in turn notifies the federal government.
In 2012-13, Jim Thorpe Area School District received $2,987 in Title III funding for English language learners. For 2014-15, Jim Thorpe Area School District received $2,851 in Title III funding.
Common Cents state initiative
The Jim Thorpe Area School Board elected to not participate in the Pennsylvania Department of Education Common Cents program. The program called for the state to audit the district, at no cost to local taxpayers, to identify ways the district could save tax dollars. After the review of the information, the district was not required to implement the recommended cost savings changes.
Real estate taxes
Property tax rates in 2016-17 were set by the Jim Thorpe Area School Board at 45.5200 mills. A mill is $1 of tax for every $1,000 of a property's assessed value. Irregular property reassessments have become a serious issue in the commonwealth as it creates a significant disparity in taxation within a community and across a region. Property taxes, in the Commonwealth of Pennsylvania, apply only to real estate - land and buildings. The property tax is not levied on cars, business inventory, or other personal property. Certain types of property are exempt from property taxes, including: places of worship, places of burial, private social clubs, charitable and educational institutions and all government property (local, state and federal). Additionally, service related, disabled US military veterans may seek an exemption from paying property taxes. Unlike other states, under Pennsylvania state tax policy, natural gas and oil pipelines are exempted from property taxes. Pipeline companies prohibit development within the 100 foot wide right-of-way, there by limiting future development options for the landowner. This limits future potential property tax revenues for the school district, by constraining future land development. Located in the marcellus shale region, Jim Thorpe Area School District is adversely impacted this way. The proposed PennEast Pipeline will pass through the district adversely impacting property owners and tax revenues.
Pennsylvania school district revenues are dominated by two main sources: 1) Property tax collections, which account for the vast majority (between 75-85%) of local revenues; and 2) Act 511 tax collections, which are around 15% of revenues for school districts. When a Pennsylvania public school district includes municipalities in two or more counties, each of which has different rates of property tax assessment, a state board equalizes the tax rates between the counties. In 2010, miscalculations by the State Tax Equalization Board (STEB) were widespread in the Commonwealth and adversely impacted funding for many school districts, including those that did not cross county borders.
The average yearly property tax paid by Carbon County residents amounts to about 4.02% of their yearly income. Carbon County ranked 228th out of the 3143 United States counties for property taxes as a percentage of median income. According to a report prepared by the Pennsylvania Department of Education, the total real estate taxes collected by all school districts in Pennsylvania rose from $6,474,133,936 in 1999-00 to $10,438,463,356 in 2008-09 and to $11,153,412,490 in 2011. For 2014-15, the total real estate taxes collected by all school districts in Pennsylvania rose to $12,280,755,102, which was a $333,324,778 over the pervious year’s collection. Property taxes in Pennsylvania are relatively high on a national scale. According to the Tax Foundation, Pennsylvania ranked 11th in the U.S. in 2008 in terms of property taxes paid as a percentage of home value (1.34%) and 12th in the country in terms of property taxes as a percentage of income (3.55%). real Pennsylvania's 2011 tax burden of 10.35% ranked 10th highest out of 50 states. The tax burden was above the national average of 9.8%. Pennsylvania's taxpayers paid $4,374 per capita in state and local taxes, including school taxes.
Act 1 Adjusted Index
The Act 1 of 2006 Index regulates the rates at which each school district can raise property taxes in Pennsylvania. Districts are not permitted to raise property taxes above their annual Act 1 Index unless they either: allow Districts voters to approve the increase through a vote by referendum or they receive an exception from the Pennsylvania Department of Education. The base index for the school year is published by the PDE in the fall of each year. Each individual school district’s Act 1 Index can be adjusted higher, depending on a number of factors, such as local property values and the personal income of district residents. Originally, Act 1 of 2006 included 10 exceptions, including: increasing pension costs, increases in special education costs, a catastrophe like a fire or flood, increase in health insurance costs for contracts in effect in 2006 or dwindling tax bases. The base index is the average of the percentage increase in the statewide average weekly wage, as determined by the Pennsylvania Department of Labor and Industry, for the preceding calendar year and the percentage increase in the Employment Cost Index for Elementary and Secondary Schools, as determined by the Bureau of Labor Statistics in the U.S. Department of Labor, for the previous 12-month period ending June 30. For a school district with a market value/personal income aid ratio (MV/PI AR) greater than 0.4000, its index equals the base index multiplied by the sum of .75 and its MV/PI AR for the current year.
In June 2011, the Pennsylvania General Assembly passed legislation eliminating six of the exceptions to the Act 1 Index. Several exceptions were maintained: 1) costs to pay interest and principal on indebtedness incurred prior to September 4, 2004 for Act 72 schools and prior to June 27, 2006 for non-Act 72 schools; 2) costs to pay interest and principal on electoral debt; 3) costs incurred in providing special education programs and services (beyond what is already paid by the State); and 4) costs due to increases of more than the Index in the school’s share of payments to PSERS (PA school employees pension fund) taking into account the state mandated PSERS contribution rate. The legislature also froze the payroll amount public school districts use to calculate the pension-plan exception at the 2012 payroll levels. Further increases in payroll cannot be used to raise the district’s exception for pension payments.
A specific timeline for Act I Index decisions is published annually, by the Pennsylvania Department of Education.
The School District Adjusted Index history for the Jim Thorpe Area School District:
For the 2016-17 budget year, Jim Thorpe Area School Board did not apply for any exceptions to exceed the District's Act 1 Index limit. Statewide 299 school districts adopted a resolution to not exceed their Act I index in 2016-17. In 2016-17, all Pennsylvania public school districts were required to make a 30.03% of payroll payment to the teacher’s pension fund (PSERS). This was in addition to the 6.02% social security employer match payment.
For the 2015-16 budget year, Jim Thorpe Area School Board applied for two exceptions to exceed their Act 1 Index limit: for special education cost and for its rapidly rising teacher pension costs. For the school budget 2015-16, 310 Pennsylvania public school districts adopted a resolution certifying that tax rates would not be increased above its Act 1 Index limit. Another 187 school districts adopted a preliminary budget leaving open the option of exceeding the Index limit. Regarding the pension costs exception, 172 school districts received approval to exceed the Index limit in full, while others received a partial approval of their request. For special education costs, 119 districts received approval to exceed their tax limit. No Pennsylvania public school districts received an approval for the grandfathered construction debts exception.
For the 2014-15 budget year, Jim Thorpe Area School Board applied for two exceptions to exceed their Act 1 Index limit:escalating teacher pension costs and rising special education costs. In 2014-15, all Pennsylvania school districts were required to make a 21.4% of payroll payment to the teacher’s pension fund (PSERS). For the school budget 2014-15, 316 Pennsylvania public school districts adopted a resolution certifying that tax rates would not be increased above its Act 1 Index limit. Another 181 school districts adopted a preliminary budget leaving open the option of exceeding the Index limit. Districts may apply for multiple exceptions each year. For the pension costs exception, 163 school districts received approval to exceed the Index in full, while others received a partial approval of their request. For special education costs, 104 districts received approval to exceed their tax limit. Seven Pennsylvania public school districts received an approval for the grandfathered construction debts exception.
For the 2013-14 budget year, Jim Thorpe Area School Board applied for one exception to exceed their Act 1 Index limit, due to rapidly rising teacher pension costs. In 2013-14, all Pennsylvania school districts were required to make a 16.93% of payroll payment to the teacher’s pension fund (PSERS). For the school budget year 2013-14, 311 Pennsylvania public school districts adopted a resolution certifying that tax rates would not be increased above their index. Another 171 school districts adopted a preliminary budget leaving open the option of exceeded the Index limit. For the pension costs exception, 169 school districts received approval to exceed the Index. For special education costs, 75 districts received approval to exceed their tax limit. Eleven Pennsylvania public school districts received an approval for grandfathered construction debts.
For the 2012-13 budget year, Jim Thorpe Area School Board did not apply for exceptions to exceed the Act 1 Index. In 2012-13, all Pennsylvania school districts were required to make a 12.36% of payroll payment to the teacher’s pension fund (PSERS). For 2012-2013 budget year, 274 school districts adopted a resolution certifying that tax rates would not be increased above their index; while 223 school districts adopted a preliminary budget leaving open the option of exceeded the Index limit. For the exception for pension costs, 194 school districts received approval to exceed the Index. For special education costs, 129 districts received approval to exceed the tax limit.
For the 2011-12 school year, Jim Thorpe Area School Board applied for an exception to exceed the Act 1 Index, due to rising teacher pension costs. In 2011-12, all Pennsylvania school districts were required to make a 8.65% of payroll payment to the teacher’s pension fund. Each year, the School Board has the option of adopting either: 1) a resolution in January certifying they will not increase taxes above their index or 2) a preliminary budget in February. A school district adopting the resolution may not apply for referendum exceptions or ask voters for a tax increase above the inflation index.
For the 2010-11 budget year, Jim Thorpe Area School Board applied for one exception to exceed their Act 1 Index limit, due to rising teacher pension costs.
For the 2009-10 school budget, the Jim Thorpe Area School Board did not apply for exceptions to exceed the Index. In the Spring of 2010, 135 Pennsylvania school boards asked to exceed their adjusted index. Approval was granted to 133 of them and 128 sought an exception for pension costs increases.
Property tax relief
In 2016, Jim Thorpe Area School District approved 4,332 homestead properties to receive $169 in tax relief. In 2013, Jim Thorpe Area School District approved 4,434 homestead properties to receive $165 in tax relief. The decline in amount was related to more residents applying for tax relief and a decline in table games tax revenues. The amount received by the District must be divided equally among all approved homesteads.
In 2009, Jim Thorpe Area School District approved 4,260 homestead properties to receive $174 in property tax relief. The relief was subtracted from the total annual school property tax bill. Property owners apply for the relief through the county Treasurer's office. Farmers can qualify for a farmstead exemption on building used for agricultural purposes. The farm must be at least 10 contiguous acres (40,000 m2) and must be the primary residence of the owner. Farmers can qualify for both the homestead exemption and the farmstead exemption. The amount of property tax relief each Pennsylvania public school district receives is announced by the PDE in May of each year. The amount of tax relief is dependent on the total tax revenue collected on the casino slots in the previous year. Thirty five percent (35%) of the slots tax revenues are used for property tax relief. In Carbon County, the highest tax relief went to Lehighton Area School District which was set at $244. The highest property tax relief provided, among Pennsylvania school districts, goes to the homesteads of Chester Upland School District in Delaware County which received $632 per approved homestead in 2010. Chester-Upland School District has consistently been the top recipient since the programs inception. The tax relief was started by Governor Edward G. Rendell with passage of the state gaming law in 2004. Rendell promised property tax payers substantial property tax relief from legalized gambling.
In Pennsylvania, the homestead exclusion reduces the assessed values of homestead properties, reducing the property tax on these homes. The homestead exclusion allows homeowners real property tax relief of up to one half of the median assessed value of homesteads in the taxing jurisdiction (county, school district, city, borough, or township).
Some Jim Thorpe Area School District residents, including: low income residents aged 65 and older; widows and widowers aged 50 and older; and people with disabilities age 18 and older, can qualify for the state's Property Tax/Rent Rebate program. The income limit is $35,000 for homeowners. Residents must apply annually to receive up to $650. The Property tax/rent rebate program is funded by revenues from the Pennsylvania Lottery. In 2012, these property tax rebates were increased by an additional 50 percent for senior households in the state, so long as those households have incomes under $30,000 and pay more than 15% of their income in property taxes.
Wellness plan
Jim Thorpe Area School District offers both a free school breakfast and a free or reduced-price lunch to children in low income families. All students attending the school can eat breakfast and lunch. Children from families with incomes at or below 130 percent of the federal poverty level are provided a breakfast and lunch at no cost to the family. Children from families with incomes between 130 and 185 percent of the federal poverty level can be charged no more than 30 cents per breakfast. A foster child whose care and placement is the responsibility of the State or who is placed by a court with a caretaker household is eligible for both a free breakfast and a free lunch. Runaway, homeless and Migrant Youth are also automatically eligible for free meals. The meals are partially funded with federal dollars through the United States Department of Agriculture.
In 2013, the USDA issued new restrictions to foods in public schools. The rules apply to foods and beverages sold on all public school district campuses during the day. They limit vending machine snacks to a maximum of 200 calories per item. Additionally, all snack foods sold at school must meet competitive nutrient standards, meaning they must have fruits, vegetables, dairy or protein in them or contain at least 10 percent of the daily value of fiber, calcium, potassium, and Vitamin D. In order to comply with the Healthy, Hunger-Free Kids Act of 2010 all US public school districts are required to raise the price of their school lunches to $2.60 regardless of the actual cost of providing the lunch. The Healthy Hunger-Free Kids Act of 2010 mandates that Districts raise their full pay lunch prices every year until the price of non-subsidized lunches equals the amount the federal government reimburses schools for free meals. That subsidy in 2013-2014 was $2.93. In 2015, federal reimbursement rates were: $3.07 per meal for students who are income-eligible for free lunches and $2.67 for those who qualify for a reduced price. School lunch participation nationally dropped from 31.6 million students in 2012 to 30.4 million in 2014, according to the federal Department of Agriculture. Pennsylvania statistics show school lunch participation dropped by 86,950 students in the same two years, from 1,127,444 in 2012 to 1,040,494 in 2014.
In 2014, President Barack Obama ordered a prohibition of advertisements for unhealthy foods on public school campuses during the school day. The US Department of Agriculture requires that students take milk as their beverage at lunch. In accordance with this law, any student requesting water in place of milk with their lunch must present a written request, signed by a doctor, documenting the need for water instead of milk.
Jim Thorpe Area School District provides health services as mandated by the Commonwealth and the federal government. Nurses are available in each building to conduct annual health screenings (data reported to the PDE and state Department of Health) and to dispense prescribed medications to students during the school day. Students can be excluded from school unless they comply with all the State Department of Health’s extensive immunization mandates. School nurses monitor each pupil for this compliance. Nurses also monitor each child's weight.
In 2016, the Pennsylvania Department of Health made available to each Pennsylvania high school the overdose antidote drug naloxone in a nasal spray. School nurses were also provided with educational materials and training developed by the National Association of School Nurses. The initial cost was covered by a grant from a private foundation.
Extracurriculars
Jim Thorpe Area School District offers a wide variety of clubs, activities and an extensive, publicly funded sports program. Eligibility for participation is determined by school board policy and in compliance with standards set by the Pennsylvania Interscholastic Athletic Association (PIAA). The PIAA mandates that student athletes must be passing at least four full-credit subjects to participate in sports.
By Pennsylvania law, all K-12 students residing in the school district, including those who attend a private nonpublic school, a Pennsylvania public cyber charter school, charter school and those who are homeschooled, are all eligible to participate in the extracurricular programs including all athletics. They must meet the same eligibility rules as the students enrolled in the district's schools.
According to PA Child Abuse Recognition and Reporting Act 126 of 2014, all volunteer coaches and all those who assist in student activities, must have criminal background checks. Like all school district employees, they must also attend an anti child abuse training once every three years.
Sports
Coaches receive compensation as outlined in the teachers' union contract. When athletic competition exceeds the regular season, additional compensation is paid. The Jim Thorpe Area School Board prohibits hazing through policy.
According to Pennsylvania’s Safety in Youth Sports Act, all sports coaches, paid and volunteer, are required to annually complete the Concussion Management Certification Training and present the certification before coaching. Jim Thorpe Area School Board enacted a ConcussionManagement Policy in 2012.
The District funds: