
Stable release 1.0.19 / July 31, 2014 Operating system License LGPL | Type Plotting Software | |
 | ||
Developer(s) Object Refinery Limited in collaboration with the community | ||
JFreeChart is an open-source framework for the programming language Java, which allows the creation of a wide variety of both interactive and non-interactive charts.
JFreeChart supports a number of various charts, including combined charts:
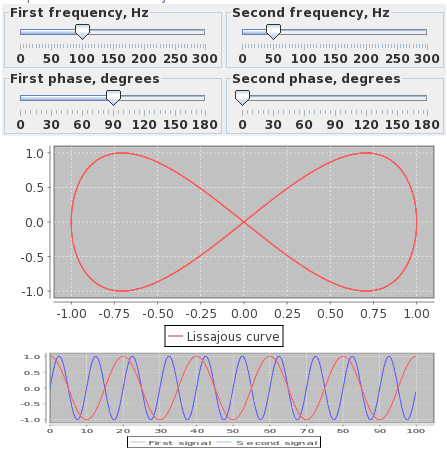
It is possible to place various markers and annotations on the plot.
JFreeChart also works with GNU Classpath, a free software implementation of the standard class library for the Java programming language.
JFreeChart automatically draws the axis scales and legends. Charts in GUI automatically get the capability to zoom in with mouse and change some settings through local menu. The existing charts can be easily updated through the listeners that the library has on its data collections.
Relation with Eastwood Charts
Eastwood Charts is an open source implementation of the Google Chart API, with charts rendered using JFreeChart. Both Eastwood Charts and JFreeChart are under the terms of LGPL and developed by David Gilbert.