
 | ||
Interference reflection microscopy or IRM is an optical microscopy technique that utilizes polarized light to form an image of an object on a glass surface. The intensity of the signal is a measure of proximity of the object to the glass surface. This technique can be used to study events at the cell membrane without the use of a (fluorescent) label in contrast to TIRF microscopy.
Contents
History
The method was first used for the studying of thin films of oil. In 1964, the first application of the technique in cell biology was introduced by Curtis to study embryonic chick heart fibroblasts. He used IRM to look at adhesion sites and distances of fibroblasts, noting that contact with the glass was mostly limited to the cell periphery and the pseudopodia.
The technique was refined and the qualitative and quantitative aspects of the technique were later described by several researchers in the 70s and 80s: Bereiter-Hahn and his colleagues correlated the technique with electron microscopy, showing that different mammalian cell lines adhere to the glass substrate in specific focal adhesion sites.
Theory
In order to form an image of the attached cell, light of a specific wavelength is passed through a polarizer. This linear polarized light is reflected by a beam splitter towards the objective, which focuses the light on the specimen. The glass surface is reflective to a certain degree and will reflect the polarized light. Light that is not reflected by the glass will travel into the cell and be reflected by the cell membrane. Three situations can occur:
- When the membrane is close to the glass, the reflected light from the glass is shifted half of a wavelength, so that light reflected from the membrane will have a phase shift compared to the reflected light from the glass phases and therefore cancel each other out (interference). This interference results in a dark pixel in the final image (the left case in the figure).
- When the membrane is not attached to the glass, the reflection from the membrane has a smaller phase shift compared to the reflected light from the glass, and therefore they will not cancel each other out, resulting in a bright pixel in the image (the right case in the figure).
- When there is no specimen, only the reflected light from the glass is detected and will appear as bright pixels in the final image.
The reflected light will travel back to the beam splitter and pass through a second polarizer, which eliminates scattered light, before reaching the detector (usually a CCD camera) in order to form the final picture. Note that the polarizers can increase the efficiency by reducing scattered light, however in a modern setup with a sensitive digital camera, they're not required.
Mathematical theory
Reflection is caused by a change in the refraction index, so on every boundary a part of the light will be reflected. The amount of reflection is given by the reflection coefficient
Reflectivity
Using typical refractive indices for glass (1.50-1.54, see list), water (1.31, see list), the cell membrane (1.48) and the cytosol (1.35), one can calculate the fraction of light being reflected by each interface. The amount of reflection increases as the difference between refractive indices increases, resulting in a large reflection from the interface between the glass surface and the culture medium (about equal to water: 1.31-1.33). This means that without a cell the image will be bright, whereas when the cell is attached, the difference between medium and the membrane causes a large reflection that is slightly shifted in phase, causing interference with the light reflected by the glass. Because the amplitude of the light reflected from the medium-membrane interface is decreased due to scattering, the attached area will appear darker but not completely black. Because the cone of light focused on the sample gives rise to different angles of incident light, there is a broad range of interference patterns. When the patterns differ by less than 1 wavelength (the zero-order fringe), the patterns converge, resulting in increased intensity. This can be obtained by using an objective with a numerical aperture greater than 1.
Requirements
In order to image cells using IRM, a microscope needs at least the following elements:
- a light source, such as a halogen lamp
- an optical filter (which passes a small range of wavelengths)
- a beam splitter (which reflects 50% and transmits 50% of the chosen wavelength)
The light source needs to produce high intensity light, as a lot of light will be lost by the beam splitter and the sample itself. Different wavelengths result in different IRM images; Bereiter-Hahn and colleagues showed that for their PtK 2 cells, light with a wavelength of 546 nm resulted in better contrast than blue light with a wavelength of 436 nm. There have been many refinements to the basic theory of IRM, most of which increase the efficiency and yield of the image formation. By placing polarizers and a quarter wave plate between the beam splitter and the specimen, the linear polarized light can be converted into circular polarized light and afterwards be converted back to linear polarized light, which increases the efficiency of the system. The circular polarizer article discusses this process in detail. Furthermore, by including a second polarizer, which is rotated 90° compared to the first polarizer, stray light can be prevented from reaching the detector, increasing the signal to noise ratio (see Figure 2 of Verschueren).
Biological applications
There are several ways IRM can be used to study biological samples. Early examples of uses of the technique focused on cell adhesion and cell migration.
Vesicle fusion
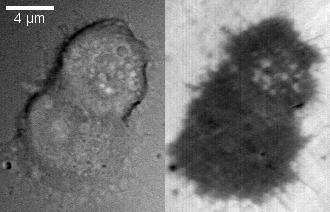
More recently, the technique has been used to study exocytosis in chromaffin cells. When imaged using DIC, chromaffin cells appear as round cells with small protrusions. When the same cell is imaged using IRM, the footprint of the cell on the glass can be clearly seen as a dark area with small protrusions (see Figure 2 in the gallery below). When vesicles fuse with the membrane, they appear as small light circles within the dark footprint (Figure 2, bright spots in the top cell in the right panel). An example of vesicle fusion in chromaffin cells using IRM is shown in movie 1. Upon stimulation with 60 mM potassium, multiple bright spots begin to appear inside the dark footprint of the chromaffin cell as a result of exocytosis of dense core granules. Because IRM doesn't require a fluorescent label, it can be combined with other imaging techniques, such as epifluorescence and TIRF microscopy to study protein dynamics together with vesicle exocytosis and endocytosis. Another benefit of the lack of fluorescent labels is reduced phototoxicity.