
 | ||
The distribution of wealth is a comparison of the wealth of various members or groups in a society. It differs from the income distribution in that it looks at the economic distribution of ownership of the assets in a society, rather than the current income of members of that society. The distribution of wealth shows economic differences as per the Gini index.
Contents
- Definition of wealth
- Data about global distribution of wealth
- Wealth distribution pyramid
- Wealth distribution in 2012
- Statistical distributions
- Redistribution of wealth and public policy
- Wealth surveys
- 21st century
- Wealth inequality
- Real estate
- Credit Suisse Report Wealth Distribution Gini 2013
- In the United States
- Data charts and graphs
- World distribution of financial wealth
- References
Definition of wealth
Wealth in the context of this article is defined as a person's net worth, expressed as:
wealth = assets − liabilitiesThe word wealth is often confused with income. These two terms describe different but related things. Wealth consists of those items of economic value that an individual owns, while income is an inflow of items of economic value. (See Stock and flow.) The relation between wealth, income, and expenses is:
change of wealth = income − expense.The distribution of income is substantially different from the distribution of wealth. According to the International Association for Research in Income and Wealth, "the world distribution of wealth is much more unequal than that of income."
If an individual has a large income but also large expenses, the net effect of that income on her or his wealth could be small or even negative.
The United Nations definition of inclusive wealth is a monetary measure which includes the sum of natural, human and physical assets.
Data about global distribution of wealth
The vast and growing gap between rich and poor has been laid bare. The gap between the rich and poor can be illustrated by the fact that the three wealthiest individuals in the world have assets that exceed those of the poorest 10 percent of the world's population. The net worth of the world's billionaires increased from less than $1 trillion in 2000 to over $7 trillion in 2015 so the gap is growing up dramatically. Statistics shows 28.4 million slaves at the end of 2006 was living in the world with zero wealth. The right hand-side fig shows millionaires as 1 percent of the world population who possess more than half of global wealth.
Wealth distribution pyramid
Personal wealth varies across adults for many reasons. Some individuals with little wealth may be at early stages in their careers, with little chance or motivation to accumulate assets. Others may have suffered business setbacks or personal misfortunes, or live in parts of the world where opportunities for wealth creation are severely limited. At the other end of the spectrum, there are individuals who have acquired a large fortune through a combination of inheritance, talent, hard work or simply being in the right place at the right time. The wealth pyramid below was prepared by Credit Suisse in 2013; it captures these differences in striking detail. It has a large base of low wealth holders, alongside upper tiers occupied by progressively fewer people. In 2013 Credit-suisse estimate that 3.2 billion individuals – more than two thirds of adults in the world – have wealth below 10,000 USD. A further one billion(adult population) fall within the 10,000 – 100,000 USD range. While the average wealth holding is modest in the base and middle segments of the pyramid, their total wealth amounts to USD 40 trillion, underlining the potential for novel consumer products and innovative financial services targeted at this often neglected segment.
The pyramid reveals that:
Wealth distribution in 2012
According to the OECD in 2012 the top 0.6% of world population (consisting of adults with more than 1 million USD in assets) or the 42 million richest people in the world held 39.3% of world wealth. The next 4.4% (311 million people) held 32.3% of world wealth. The bottom 95% held 28.4% of world wealth. The large gaps of the report get by the Gini index to 0.893, and are larger than gaps in global income inequality, measured in 2009 at 0.38. For example, in 2012 the bottom 60% of the world population held same wealth in 2012 as the people on Forbes' Richest list consisting of 1,226 richest billionaires of the world.
Statistical distributions
There are many ways in which the distribution of wealth can be analyzed. One example is to compare the wealth of the richest one percent with the wealth of the median (or 50th) percentile. In many societies, the richest ten percent control more than half of the total wealth.
Pareto Distribution has often been used to mathematically quantify the distribution of wealth, since it models a random distribution.
Wealth over people (WOP) curves are a visually compelling way to show the distribution of wealth in a nation. WOP curves are modified distribution of wealth curves. The vertical and horizontal scales each show percentages from zero to one hundred. We imagine all the households in a nation being sorted from richest to poorest. They are then shrunk down and lined up (richest at the left) along the horizontal scale. For any particular household, its point on the curve represents how their wealth compares (as a proportion) to the average wealth of the richest percentile. For any nation, the average wealth of the richest 1/100 of households is the topmost point on the curve (people, 1%; wealth, 100%) or (p=1, w=100) or (1, 100). In the real world two points on the WOP curve are always known before any statistics are gathered. These are the topmost point (1, 100) by definition, and the rightmost point (poorest people, lowest wealth) or (p=100, w=0) or (100, 0). This unfortunate rightmost point is given because there are always at least one percent of households (incarcerated, long term illness, etc.) with no wealth at all. Given that the topmost and rightmost points are fixed … our interest lies in the form of the WOP curve between them. There are two extreme possible forms of the curve. The first is the "perfect communist" WOP. It is a straight line from the leftmost (maximum wealth) point horizontally across the people scale to p=99. Then it drops vertically to wealth = 0 at (p=100, w=0).
The other extreme is the "perfect tyranny" form. It starts on the left at the Tyrant's maximum wealth of 100%. It then immediately drops to zero at p=2, and continues at zero horizontally across the rest of the people. That is, the tyrant and his friends (the top percentile) own all the nation's wealth. All other citizens are serfs or slaves. An obvious intermediate form is a straight line connecting the left/top point to the right/bottom point. In such a "Diagonal" society a household in the richest percentile would have just twice the wealth of a family in the median (50th) percentile. Such a society is compelling to many (especially the poor). In fact it is a comparison to a diagonal society that is the basis for the Gini values used as a measure of the disequity in a particular economy. These Gini values (40.8 in 2007) show the United States to be the third most dis-equitable economy of all the developed nations (behind Denmark and Switzerland). The US WOP Curve is shown below. As you will see it approaches the "tyrant's curve".
A curve that is visually appealing is the quarter-circle curve or the wagon wheel WOP. Some reformers feel that any nation's tax system should be set up so that its WOP never gets sucked in beyond the wagon wheel form.
More sophisticated models have also been proposed.
Redistribution of wealth and public policy
In many societies, attempts have been made, through property redistribution, taxation, or regulation, to redistribute wealth, sometimes in support of the upper class, and sometimes to diminish economic inequality.
Examples of this practice go back at least to the Roman republic in the third century B.C., when laws were passed limiting the amount of wealth or land that could be owned by any one family. Motivations for such limitations on wealth include the desire for equality of opportunity, a fear that great wealth leads to political corruption, to the belief that limiting wealth will gain the political favor of a voting bloc, or fear that extreme concentration of wealth results in rebellion. Various forms of socialism attempt to diminish the unequal distribution of wealth and thus the conflicts and social problems (see image below) arising from it.
During the Age of Reason, Francis Bacon wrote "Above all things good policy is to be used so that the treasures and monies in a state be not gathered into a few hands… Money is like fertilizer, not good except it be spread."
Communism arose as a reaction to a distribution of wealth in which a few lived in luxury while the masses lived in extreme poverty. In The Communist Manifesto, Marx and Engels wrote "From each according to his ability, to each according to his need." While the ideas of Marx have nominally been embraced by various states (Russia, Cuba, Vietnam and China in the 20th century), Marxist utopia remains elusive.
On the other hand, the combination of labor movements, technology, and social liberalism has diminished extreme poverty in the developed world today, though extremes of wealth and poverty continue in the Third World.
In the Outlook on the Global Agenda 2014 from the World Economic Forum the widening income disparities come second as a worldwide risk.
Wealth surveys
Many countries have national wealth surveys, for example:
21st century
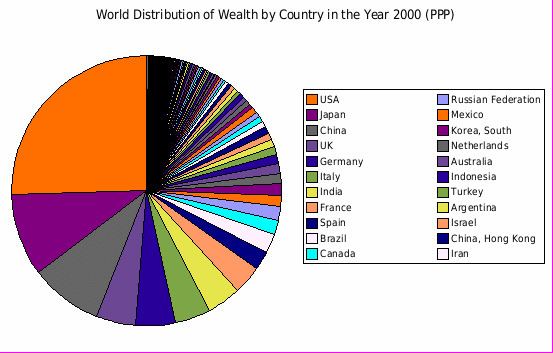
At the end of the 20th century, wealth was concentrated among the G8 and Western industrialized nations, along with several Asian and OPEC nations.
Wealth inequality
A study by the World Institute for Development Economics Research at United Nations University reports that the richest 1% of adults alone owned 40% of global assets in the year 2000, and that the richest 10% of adults accounted for 85% of the world total. The bottom half of the world adult population owned 1% of global wealth. Moreover, another study found that the richest 2% own more than half of global household assets.
Real estate
While sizeable numbers of households own no land, few have no income. For example, 10% of land owners (all corporations) in Baltimore, Maryland own 58% of the taxable land value. The bottom 10% of those who own any land own less than 1% of the total land value. This form of analysis as well as Gini coefficient analysis has been used to support land value taxation.
Credit Suisse Report – Wealth Distribution & Gini (2013)
This table was created from information provided by the Credit Suisse, Research Institute's "Global Wealth Databook", published 2013.
In the United States
According to PolitiFact, in 2011 the 400 wealthiest Americans "have more wealth than half of all Americans combined." Inherited wealth may help explain why many Americans who have become rich may have had a "substantial head start". In September 2012, according to the Institute for Policy Studies, "over 60 percent" of the Forbes richest 400 Americans "grew up in substantial privilege".
In 2007, the richest 1% of the American population owned 34.6% of the country's total wealth (excluding human capital), and the next 19% owned 50.5%. The top 20% of Americans owned 85% of the country's wealth and the bottom 80% of the population owned 15%. From 1922 to 2010, the share of the top 1% varied from 19.7% to 44.2%, the big drop being associated with the drop in the stock market in the late 1970s. Ignoring the period where the stock market was depressed (1976–1980) and the period when the stock market was overvalued (1929), the share of wealth of the richest 1% remained extremely stable, at about a third of the total wealth. Financial inequality was greater than inequality in total wealth, with the top 1% of the population owning 42.7%, the next 19% of Americans owning 50.3%, and the bottom 80% owning 7%. However, after the Great Recession which started in 2007, the share of total wealth owned by the top 1% of the population grew from 34.6% to 37.1%, and that owned by the top 20% of Americans grew from 85% to 87.7%. The Great Recession also caused a drop of 36.1% in median household wealth but a drop of only 11.1% for the top 1%, further widening the gap between the 1% and the 99%. During the economic expansion between 2002 and 2007, the income of the top 1% grew 10 times faster than the income of the bottom 90%. In this period 66% of total income gains went to the 1%, who in 2007 had a larger share of total income than at any time since 1928.
Dan Ariely and Michael Norton show in a study (2011) that US citizens across the political spectrum significantly underestimate the current US wealth inequality and would prefer a more egalitarian distribution of wealth, raising questions about ideological disputes over issues like taxation and welfare.
Data, charts, and graphs
and resulting Gini indices for mean incomes: 1989: 51.1, 1992: 47.8, 1995: 49.0, 1998: 50.4, 2001: 52.6, 2004: 51.4
World distribution of financial wealth
In 2007, 147 companies controlled nearly 40 percent of the monetary value of all transnational corporations.