
District Wasseramt Elevation 455 m Population 815 (31 Dec 2008) | SFOS number 2523 Local time Tuesday 10:21 PM Postal code 4557 | |
 | ||
Weather 6°C, Wind NE at 2 km/h, 75% Humidity | ||
Horriwil is a municipality in the district of Wasseramt in the canton of Solothurn in Switzerland.
Contents
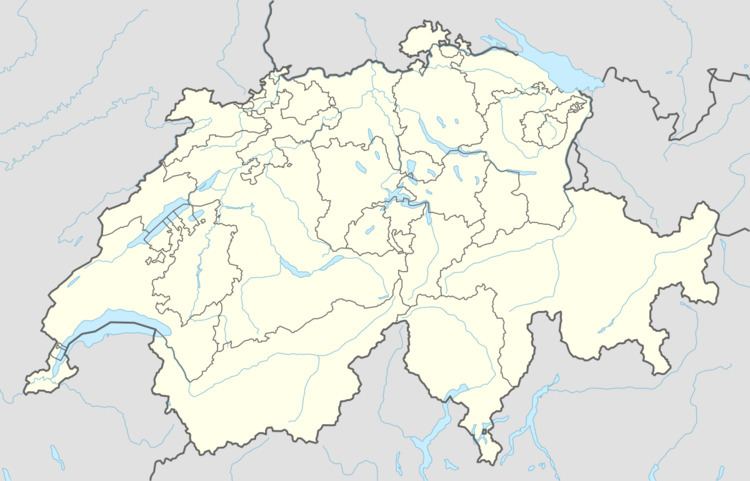
- Map of 4557 Horriwil Switzerland
- History
- Geography
- Coat of arms
- Demographics
- Politics
- Economy
- Religion
- Education
- References
Map of 4557 Horriwil, Switzerland
History
Horriwil is first mentioned around 1263-64 as C. de Horgenwile.
Geography
Horriwil has an area, as of 2009, of 2.63 square kilometers (1.02 sq mi). Of this area, 1.54 km2 (0.59 sq mi) or 58.6% is used for agricultural purposes, while 0.68 km2 (0.26 sq mi) or 25.9% is forested. Of the rest of the land, 0.36 km2 (0.14 sq mi) or 13.7% is settled (buildings or roads), 0.01 km2 (2.5 acres) or 0.4% is either rivers or lakes and 0.01 km2 (2.5 acres) or 0.4% is unproductive land.
Of the built up area, housing and buildings made up 9.9% and transportation infrastructure made up 2.7%. Out of the forested land, all of the forested land area is covered with heavy forests. Of the agricultural land, 44.5% is used for growing crops and 11.8% is pastures, while 2.3% is used for orchards or vine crops. All the water in the municipality is flowing water.
The municipality is located in the Wasseramt district, stretching across a gentle plain on the northwest side of the Wasseramt glacial and ground moraine zone. The plain is about 20–30 m (66–98 ft) above the level of the nearby Öschbach.
Coat of arms
The blazon of the municipal coat of arms is Gules on a Bend sinister a Ploughshare Azure.
Demographics
Horriwil has a population (as of December 2015) of 865. As of 2008, 2.2% of the population are resident foreign nationals. Over the last 10 years (1999–2009 ) the population has changed at a rate of 1.1%. It has changed at a rate of -4% due to migration and at a rate of 4% due to births and deaths.
Most of the population (as of 2000) speaks German (785 or 97.9%), with French being second most common (5 or 0.6%) and Italian being third (4 or 0.5%).
As of 2008, the gender distribution of the population was 52.1% male and 47.9% female. The population was made up of 411 Swiss men (50.2% of the population) and 16 (2.0%) non-Swiss men. There were 382 Swiss women (46.6%) and 10 (1.2%) non-Swiss women. Of the population in the municipality 247 or about 30.8% were born in Horriwil and lived there in 2000. There were 306 or 38.2% who were born in the same canton, while 190 or 23.7% were born somewhere else in Switzerland, and 51 or 6.4% were born outside of Switzerland.
In 2008 there were 6 live births to Swiss citizens and were 4 deaths of Swiss citizens. Ignoring immigration and emigration, the population of Swiss citizens increased by 2 while the foreign population remained the same. There were 3 Swiss men and 1 Swiss woman who emigrated from Switzerland. The total Swiss population change in 2008 (from all sources, including moves across municipal borders) was a decrease of 3 and the non-Swiss population decreased by 3 people. This represents a population growth rate of -0.7%.
The age distribution, as of 2000, in Horriwil is; 74 children or 9.2% of the population are between 0 and 6 years old and 142 teenagers or 17.7% are between 7 and 19. Of the adult population, 39 people or 4.9% of the population are between 20 and 24 years old. 223 people or 27.8% are between 25 and 44, and 202 people or 25.2% are between 45 and 64. The senior population distribution is 92 people or 11.5% of the population are between 65 and 79 years old and there are 30 people or 3.7% who are over 80.
As of 2000, there were 311 people who were single and never married in the municipality. There were 409 married individuals, 49 widows or widowers and 33 individuals who are divorced.
As of 2000, there were 295 private households in the municipality, and an average of 2.6 persons per household. There were 65 households that consist of only one person and 30 households with five or more people. Out of a total of 299 households that answered this question, 21.7% were households made up of just one person and there were 1 adults who lived with their parents. Of the rest of the households, there are 97 married couples without children, 123 married couples with children There were 7 single parents with a child or children. There were 2 households that were made up of unrelated people and 4 households that were made up of some sort of institution or another collective housing.
In 2000 there were 178 single family homes (or 76.1% of the total) out of a total of 234 inhabited buildings. There were 21 multi-family buildings (9.0%), along with 29 multi-purpose buildings that were mostly used for housing (12.4%) and 6 other use buildings (commercial or industrial) that also had some housing (2.6%). Of the single family homes 8 were built before 1919, while 28 were built between 1990 and 2000. The greatest number of single family homes (49) were built between 1971 and 1980.
In 2000 there were 299 apartments in the municipality. The most common apartment size was 5 rooms of which there were 88. There were 2 single room apartments and 175 apartments with five or more rooms. Of these apartments, a total of 293 apartments (98.0% of the total) were permanently occupied, while 5 apartments (1.7%) were seasonally occupied and 1 apartments (0.3%) were empty. As of 2009, the construction rate of new housing units was 1.2 new units per 1000 residents. The vacancy rate for the municipality, in 2010, was 2.09%.
The historical population is given in the following chart:
Politics
In the 2007 federal election the most popular party was the SVP which received 29.1% of the vote. The next three most popular parties were the CVP (25.81%), the FDP (18.67%) and the SP (16.34%). In the federal election, a total of 382 votes were cast, and the voter turnout was 59.0%.
Economy
As of 2010, Horriwil had an unemployment rate of 2.3%. As of 2008, there were 25 people employed in the primary economic sector and about 11 businesses involved in this sector. 125 people were employed in the secondary sector and there were 14 businesses in this sector. 45 people were employed in the tertiary sector, with 10 businesses in this sector. There were 414 residents of the municipality who were employed in some capacity, of which females made up 41.8% of the workforce.
In 2008 the total number of full-time equivalent jobs was 168. The number of jobs in the primary sector was 17, all of which were in agriculture. The number of jobs in the secondary sector was 119 of which 100 or (84.0%) were in manufacturing and 18 (15.1%) were in construction. The number of jobs in the tertiary sector was 32. In the tertiary sector; 2 or 6.3% were in wholesale or retail sales or the repair of motor vehicles, 2 or 6.3% were in the movement and storage of goods, 3 or 9.4% were in a hotel or restaurant, 1 was in the information industry, 2 or 6.3% were technical professionals or scientists, 5 or 15.6% were in education and 16 or 50.0% were in health care.
In 2000, there were 81 workers who commuted into the municipality and 316 workers who commuted away. The municipality is a net exporter of workers, with about 3.9 workers leaving the municipality for every one entering. Of the working population, 15% used public transportation to get to work, and 60.9% used a private car.
Religion
From the 2000 census, 416 or 51.9% were Roman Catholic, while 270 or 33.7% belonged to the Swiss Reformed Church. Of the rest of the population, and there were 25 individuals (or about 3.12% of the population) who belonged to another Christian church. There were 7 (or about 0.87% of the population) who were Islamic. 80 (or about 9.98% of the population) belonged to no church, are agnostic or atheist, and 4 individuals (or about 0.50% of the population) did not answer the question.
Education
In Horriwil about 363 or (45.3%) of the population have completed non-mandatory upper secondary education, and 105 or (13.1%) have completed additional higher education (either university or a Fachhochschule). Of the 105 who completed tertiary schooling, 81.0% were Swiss men, 12.4% were Swiss women, 4.8% were non-Swiss men.
During the 2010-2011 school year there were a total of 68 students in the Horriwil school system. The education system in the Canton of Solothurn allows young children to attend two years of non-obligatory Kindergarten. During that school year, there were 11 children in kindergarten. The canton's school system requires students to attend six years of primary school, with some of the children attending smaller, specialized classes. In the municipality there were 57 students in primary school. The secondary school program consists of three lower, obligatory years of schooling, followed by three to five years of optional, advanced schools. All the lower secondary students from Horriwil attend their school in a neighboring municipality.
As of 2000, there were 13 students in Horriwil who came from another municipality, while 54 residents attended schools outside the municipality.