
 | ||
Harmonic pitch class profiles (HPCP) is a group of features that a computer program extracts from an audio signal, based on a pitch class profile—a descriptor proposed in the context of a chord recognition system. HPCP are an enhanced pitch distribution feature that are sequences of feature vectors that, to a certain extent, describe tonality, measuring the relative intensity of each of the 12 pitch classes of the equal-tempered scale within an analysis frame. Often, the twelve pitch spelling attributes are also referred to as chroma and the HPCP features are closely related to what is called chroma features or chromagrams.
Contents
By processing musical signals, software can identify HPCP features and use them to estimate the key of a piece, to measure similarity between two musical pieces (cover version identification), to perform content-based audio retrieval (audio matching), to extract the musical structure (audio structure analysis), and to classify music in terms of composer, genre or mood. The process is related to time-frequency analysis. In general, chroma features are robust to noise (e.g., ambient noise or percussive sounds), independent of timbre and instrumentation and independent of loudness and dynamics.
HPCPs are tuning independent and consider the presence of harmonic frequencies, so that the reference frequency can be different from the standard A 440 Hz. The result of HPCP computation is a 12, 24, or 36-bin octave-independent histogram depending on the desired resolution, representing the relative intensity of each 1, 1/2, or 1/3 of the 12 semitones of the equal tempered scale.
General HPCP feature extraction procedure
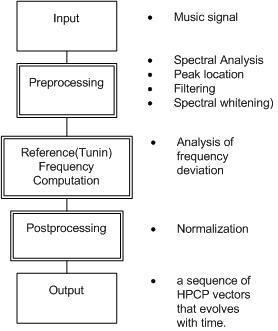
The block diagram of the procedure is shown in Fig.1 and is further detailed in.
The General HPCP feature extraction procedure is summarized as follows:
- Input musical signal.
- Do spectral analysis to obtain the frequency components of the music signal.
- Use Fourier transform to convert the signal into a spectrogram. (The Fourier transform is a type of time-frequency analysis.)
- Do frequency filtering. A frequency range of between 100 and 5000 Hz is used.
- Do peak detection. Only the local maximum values of the spectrum are considered.
- Do reference frequency computation procedure. Estimate the deviation with respect to 440 Hz.
- Do Pitch class mapping with respect to the estimated reference frequency. This is a procedure for determining the pitch class value from frequency values. A weighting scheme with cosine function is used. It considers the presence of harmonic frequencies (harmonic summation procedure), taking account a total of 8 harmonics for each frequency. To map the value on a one-third of a semitone, the size of the pitch class distribution vectors must be equal to 36.
- Normalize the feature frame by frame dividing through the maximum value to eliminate dependency on global loudness. And then we can get a result HPCP sequence like Fig.2.
System of measuring similarity between two songs
After getting the HPCP feature, the pitch of the signal in a time section is known. The HPCP feature has been used to compute similarity between two songs in many research papers. A system of measuring similarity between two songs is shown in Fig.3. First, time-frequency analysis is needed to extract the HPCP feature. And then set two songs' HPCP feature to a global HPCP, so there is a standard of comparing. The next step is to use the two features to construct a binary similarity matrix. Smith–Waterman algorithm is used to construct a local alignment matrix H in the Dynamic Programming Local Alignment. Finally, after doing post processing, the distance between two songs can be computed.