
 | ||
A graphical model or probabilistic graphical model (PGM) is a probabilistic model for which a graph expresses the conditional dependence structure between random variables. They are commonly used in probability theory, statistics—particularly Bayesian statistics—and machine learning.
Contents
Types of graphical models
Generally, probabilistic graphical models use a graph-based representation as the foundation for encoding a complete distribution over a multi-dimensional space and a graph that is a compact or factorized representation of a set of independences that hold in the specific distribution. Two branches of graphical representations of distributions are commonly used, namely, Bayesian networks and Markov random fields. Both families encompass the properties of factorization and independences, but they differ in the set of independences they can encode and the factorization of the distribution that they induce.
Bayesian network
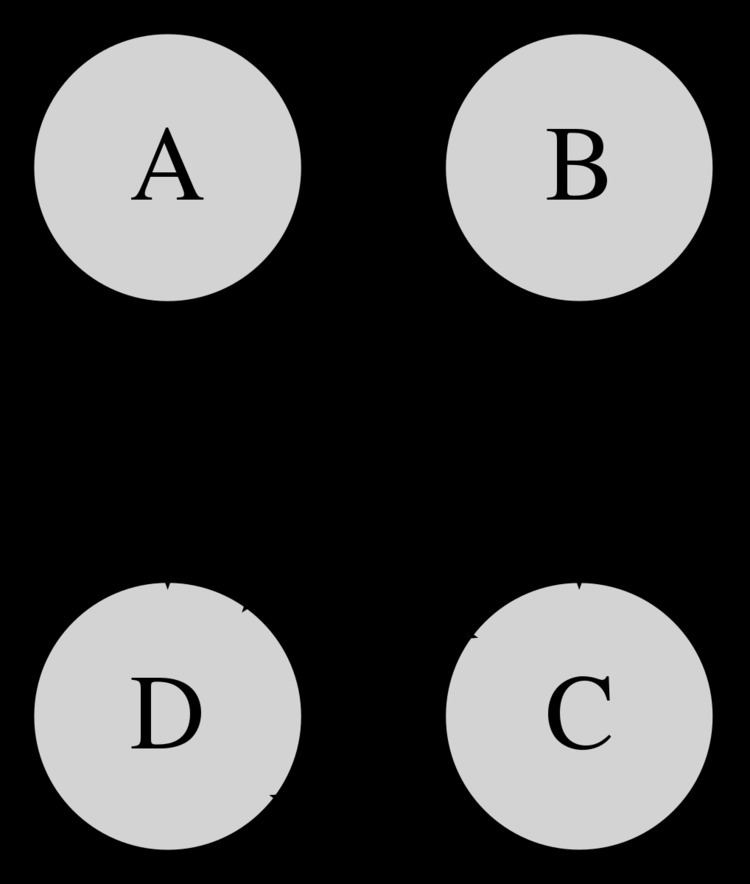
If the network structure of the model is a directed acyclic graph, the model represents a factorization of the joint probability of all random variables. More precisely, if the events are
where
Any two nodes are conditionally independent given the values of their parents. In general, any two sets of nodes are conditionally independent given a third set if a criterion called d-separation holds in the graph. Local independences and global independences are equivalent in Bayesian networks.
This type of graphical model is known as a directed graphical model, Bayesian network, or belief network. Classic machine learning models like hidden Markov models, neural networks and newer models such as variable-order Markov models can be considered special cases of Bayesian networks.
Markov random field
A Markov random field, also known as a Markov network, is a model over an undirected graph. A graphical model with many repeated subunits can be represented with plate notation.
Other types
Applications
The framework of the models, which provides algorithms for discovering and analyzing structure in complex distributions to describe them succinctly and extract the unstructured information, allows them to be constructed and utilized effectively. Applications of graphical models include causal inference, information extraction, speech recognition, computer vision, decoding of low-density parity-check codes, modeling of gene regulatory networks, gene finding and diagnosis of diseases, and graphical models for protein structure.