
 | ||
In mathematics, the graph of a function f is the collection of all ordered pairs (x, f(x)). If the function input x is a scalar, the graph is a two-dimensional graph, and for a continuous function is a curve. If the function input x is an ordered pair (x1, x2) of real numbers, the graph is the collection of all ordered triples (x1, x2, f(x1, x2)), and for a continuous function is a surface (see three-dimensional graph).
Contents
- Functions of one variable
- Functions of two variables
- Normal to a graph
- Generalizations
- Hardware
- Software
- References
Informally, if x is a real number and f is a real function, graph may mean the graphical representation of this collection, in the form of a line chart: a curve on a Cartesian plane, together with Cartesian axes, etc. Graphing on a Cartesian plane is sometimes referred to as curve sketching. The graph of a function on real numbers may be mapped directly to the graphic representation of the function. For general functions, a graphic representation cannot necessarily be found and the formal definition of the graph of a function suits the need of mathematical statements, e.g., the closed graph theorem in functional analysis.
The concept of the graph of a function is generalized to the graph of a relation. Note that although a function is always identified with its graph, they are not the same because it will happen that two functions with different codomain could have the same graph. For example, the cubic polynomial mentioned below is a surjection if its codomain is the real numbers but it is not if its codomain is the complex field.
To test whether a graph of a curve is a function of x, one uses the vertical line test. To test whether a graph of a curve is a function of y, one uses the horizontal line test. If the function has an inverse, the graph of the inverse can be found by reflecting the graph of the original function over the line y = x.
In science, engineering, technology, finance, and other areas, graphs are tools used for many purposes. In the simplest case one variable is plotted as a function of another, typically using rectangular axes; see Plot (graphics) for details.
In the modern foundation of mathematics known as set theory, a function and its graph are essentially the same thing.
Functions of one variable
The graph of the function.
is
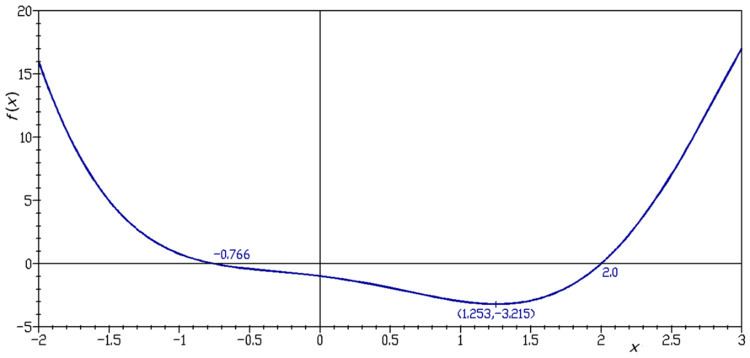
The graph of the cubic polynomial on the real line
is
If this set is plotted on a Cartesian plane, the result is a curve (see figure).
Functions of two variables
The graph of the trigonometric function
is
If this set is plotted on a three dimensional Cartesian coordinate system, the result is a surface (see figure).
Oftentimes it is helpful to show with the graph, the gradient of the function and several level curves. The level curves can be mapped on the function surface or can be projected on the bottom plane. The second figure shows such a drawing of the graph of the function:
Normal to a graph
Given a function f of n variables:
(up to multiplication by a constant). This is seen by considering the graph as a level set of the function
Generalizations
The graph of a function is contained in a Cartesian product of sets. An X–Y plane is a cartesian product of two lines, called X and Y, while a cylinder is a cartesian product of a line and a circle, whose height, radius, and angle assign precise locations of the points. Fibre bundles aren't cartesian products, but appear to be up close. There is a corresponding notion of a graph on a fibre bundle called a section.
Hardware
Software
See List of graphing software