
 | ||
Geophysical signal analysis is concerned with the detection and a subsequent processing of signals. Any signal which is varying conveys valuable information. Hence to understand the information embedded in such signals, we need to 'detect' and 'extract data' from such quantities. Geophysical signals are of extreme importance to us as they are information bearing signals which carry data related to petroleum deposits beneath the surface and seismic data. Analysis of geophysical signals also offers us a qualitative insight into the possibility of occurrence of a natural calamity such as earthquakes or volcanic eruptions.
Contents
- Background
- Spatial and temporal frequency
- Digitizing in time and space domain
- Tensor
- Estimating the positions of the underground objects by measuring gravitational measurements
- Measurement of Earths magnetic fields
- Atom interferometer
- Analysis of geophysical signals
- Spectral analysis
- Beamforming
- Upward continuation in analyzing magnetic fields
- Geothermal energy mapping
- Oil exploration
- References
Gravitational and magnetic fields are detected using extremely sensitive gravitometers and magnetometers respectively. The gravitational field changes are measured using devices such as atom interferometers. A superconducting quantum interference device (SQUID) is an extremely sensitive device which measures minute changes in the magnetic field. After detection, the data from these signals is extracted by performing spectral analysis, filtering and beamforming techniques. These techniques can be used in oil exploration to estimate the position of underground objects, harnessing geothermal energy.
Background
The position of underground objects can be determined by measuring the gradient in Earth's gravitational field. It is known that an object with heavier mass “attracts” other objects of a considerably lower value of mass. This force of attraction is explained by understanding the following topics.
Spatial and temporal frequency
Temporal frequency is the number of occurrences of an event in unit "time". It is defined relative to time. Frequency of a wave can be X cycles per second. Spatial frequency on the other hand is the characteristic of any entity that periodically varies in space.
Digitizing in time and space domain
Digitizing of any signal has two aspects : "digitizing in time domain" and "digitizing in space domain". These concepts pertain to the signals varying in space, time or both.
Tensor
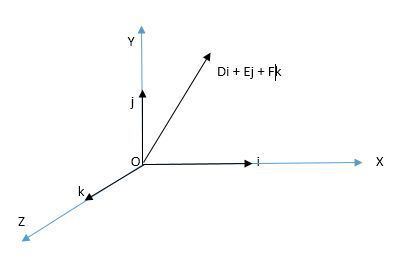
To explain the concept of a tensor, consider the definition of a vector: “Vector is a quantity having both magnitude and direction. Vectors are tensors with rank 1”. There is only basis vector for a component. Ex: Velocity is represented as Ai + Bj + Ck where i,j,k are unit vectors in the x,y,z directions respectively. We can see that there is a one-one mapping between the basis vector and its component.
Tensor, on the other hand has rank greater than one. Gravitational field is an example for a tensor.
The set of figures on the left represent the various components of the gravitational field. These components fully characterize all the forces acting on a body. These can be represented in a matrix form as follows:
Now that we are familiar with the concepts of gravity and tensors, a qualitative discussion of gravity and its significance in geophysical analysis can be done. A certain mass distribution creates a gravitational force field around it, In other words, the object under consideration has a finite mass ‘M’ and hence bends the space around it. The gravitational field gradient is given by the divergence of the gravitational field.
Estimating the positions of the underground objects by measuring gravitational measurements
The method being discussed here assumes that the mass distribution of the underground objects of interest is already known and hence the problem of estimating their location boils down to parametric localisation. Since the mass distribution of objects of interest is already known, say underground objects with center of masses(CM1, CM2…CMn) are located under the earth and at positions p1, p2...pn. The gravity gradient(components of the gravity field) is measured using a spinning wheel with accelerometers also called as the gravity gradiometer. The instrument is positioned in different orientations to measure the respective component of gravitational field. The values of gravitational gradient tensors are calculated and analyzed. The analysis includes observing the contribution of each object under consideration. A maximum likelihood procedure is followed and Cramér–Rao bound (CRB) is computed to assess the quality of location estimate.
Measurement of Earth’s magnetic fields
Magnetometers are used to measure the magnetic fields, magnetic anomalies in the earth. The sensitivity of magnetometers depends upon the requirement. Ex, the variations in the geomagnetic fields can be to the order of several aT where 1aT = 10^-18T . In such cases, specialized magnetometers such as a superconducting quantum interference device (SQUID) are used.
Jim Zimmerman co-developed the superconducting quantum interference device during his tenure at Ford research lab. However, events leading to the invention of squid were in fact, serendipitous. John Lambe, during his experiments on nuclear magnetic resonance noticed that the electrical properties of indium varied due to a change in the magnetic field of the order of few nT. But, Lambe was not able to fully recognise the utility of SQUID.
SQUIDs have the capability to detect magnetic fields of extremely low magnitude. This is due to the virtue of Josephson junctions. Jim Zimmerman pioneered the development of SQUID by proposing a new approach to making the Josephson junctions. He made use of niobium wires and niobium ribbons to form two Josephson junctions connected in parallel. The ribbons act as the interruptions to the superconducting current flowing through the wires. The junctions are very sensitive to the magnetic fields and hence are very useful in measuring fields of the order of 10−18 T.
Background
The motion of any mass is affected by the gravitational field. The motion of planets is affected by the Sun's enormous gravitational field. Likewise, a heavier object will influence the motion of other objects of smaller mass in its vicinity. However, this change in the motion is very small compared to the motion of heavenly bodies. Hence, special instruments are required to measure such a minute change.
Atom interferometer
Atom interferometers work on the principle of diffraction. The diffraction gratings are nano fabricated materials with a separation of a quarter wavelength of light. When a beam of atoms pass through a diffraction grating, due the inherent wave nature of atoms, they split and form interference fringes on the screen. An atom interferometer is very sensitive to the changes in the positions of atoms. As heavier objects shifts the position of the atoms nearby, displacement of the atoms can be measured by detecting a shift in the interference fringes.
Analysis of geophysical signals
Any signal conveys information in two ways :
Spectral analysis
Fourier representation
The Fourier expansion of a time domain signal is the representation of the signal as a sum of its frequency components, specifically sum of sines and cosines. Joseph Fourier came up with the Fourier representation to estimate the heat distribution of a body. The same approach can be followed to analyse the multi-dimensional signals such as electromagnetic waves.
The 4d - Fourier representation of such signals is given by:
S(K, ω) = ∫ ∫ s(x,t) exp [-j(ωt- k'x)] dx dt
Filtering
Simply put, space time signal filtering problem can be thought as localizing the speed and direction of a particular signal. The design of filters for spacetime signals follows a similar approach as that of 1-D signals. The filters for 1-D signals are designed in such a way that if the requirement of the filter is to extract frequency components in a particular non-zero range of frequencies, a band-pass filter with appropriate passband and stop band frequencies in determined. Similarly, in the case of multi-dimensional systems, the wavenumber-frequency response of filters is designed in such a way thatit is unity in the designed region of (k, ω) a.k.a. wavenumber - frequency and zero elsewhere.
Beamforming
This approach is applied for filtering spacetime signals. It is designed to isolate signals travelling in a particular direction. One of the simplest filters is weighted delay and sum beamformer. The output is the average of the linear combination of delayed signals. In other words, the beamformer output is formed by averaging weighted and delayed versions of receiver signals. The delay is chosen such that the passband of beamformer is directed to a specific direction in the space.
Upward continuation in analyzing magnetic fields
This method can be used to estimate the depth of the magnetic materials beneath the earth. The magnetic data is processed by the spectral methods such as Fourier transforms. The FFT algorithm makes the spectral analysis of signals fast, easy and efficient.The FFT computations can be performed in the machines which allow us to perform contour mapping. The upward continuation method attenuates the wave number anomalies associated with the shallow magnetic sources. Thus the signal components contain the information about the objects situated deep beneath the earth.
Geothermal energy mapping
The gravity data is collected from a detailed geographical surveys. The gravitational field intensity is measured using the gravimeter. Also, the elevations have to measured to account for the height corrections. The Bouguer anomalies in the gravity data are analysed. The Bouguer anomaly is a correction of the gravitational data which takes into account the heights of different terrains.
The Bouguer data is coupled with other magnetic and seismic measurements of the region. This data is instrumental in revealing the tectonic and structural geography that area.
After the data is obtained, some of the observations from the Bouguer data indicate the following:
Oil exploration
The process of oil exploration] starts with finding a layer of impermeable substance under which oil is buried. Until a well is drilled, one can't accurately determine the presence of oil. However, by the efficient use of geothermal techniques, we can detect a layer beneath which oil may be trapped.
There are several approaches to detect the "oil traps"