
 | ||
Genetic distance is a measure of the genetic divergence between species or between populations within a species. Populations with many similar alleles have small genetic distances. This indicates that they are closely related and have a recent common ancestor.
Contents
- Biological foundation
- Measures of genetic distance
- Neis standard genetic distance
- Cavalli Sforza chord distance
- Reynolds Weir and Cockerhams genetic distance
- Other measures of genetic distance
- Neis DA distance 1983
- Euclidean distance
- Goldstein distance 1995
- Neis minimum genetic distance 1973
- Rogers distance 1972
- Fixation index
- Software
- References
Genetic distance is useful for reconstructing the history of populations. For example, evidence from genetic distance suggests that African and Eurasian people diverged about 100,000 years ago. Genetic distance is also used for understanding the origin of biodiversity. For example, the genetic distances between different breeds of domesticated animals are often investigated in order to determine which breeds should be protected to maintain genetic diversity.
Biological foundation
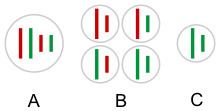
In the genome of an organism, each gene is located at a specific place called the locus for that gene. Allelic variations at these loci cause phenotypic variation within species (e.g. hair colour, eye colour). However, most alleles do not have an observable impact on the phenotype. Within a population new alleles generated by mutation either die out or spread throughout the population. When a population is split into different isolated populations (by either geographical or ecological factors), mutations that occur after the split will be present only in the isolated population. Random fluctuation of allele frequencies also produces genetic differentiation between populations. This process is known as genetic drift. By examining the differences between allele frequencies between the populations and computing genetic distance, we can estimate how long ago the two populations were separated.
Measures of genetic distance
Although it is simple to define genetic distance as a measure of genetic divergence, there are several different statistical measures that have been proposed. This has happened because different authors considered different evolutionary models. The most commonly used are Nei's genetic distance, Cavalli-Sforza and Edwards measure, and Reynolds, Weir and Cockerham's genetic distance, listed below.
In all the formulae in this section,
Nei's standard genetic distance
In 1972, Masatoshi Nei published what came to be known as Nei's standard genetic distance. This distance has the nice property that if the rate of genetic change (amino acid substitution) is constant per year or generation then Nei's standard genetic distance (D) increases in proportion to divergence time. This measure assumes that genetic differences are caused by mutation and genetic drift.
This distance can also be expressed in terms of the arithmetic mean of gene identity. Let
where
Nei's standard distance can then be written as
Cavalli-Sforza chord distance
In 1967 Luigi Luca Cavalli-Sforza and A. W. F. Edwards published this measure. It assumes that genetic differences arise due to genetic drift only. One major advantage of this measure is that the populations are represented in a hypersphere, the scale of which is one unit per gene substitution. The chord distance in the hyperdimensional sphere is given by
Some authors drop the factor
Reynolds, Weir, and Cockerham's genetic distance
In 1983, this measure was published by John Reynolds, B.S. Weir and C. Clark Cockerham. This measure assumes that genetic differentiation occurs only by genetic drift without mutations. It estimates the coancestry coefficient
Other measures of genetic distance
Many other measures of genetic distance have been proposed with varying success.
Nei's DA distance 1983
This distance assumes that genetic differences arise due to mutation and genetic drift, but this distance measure is known to give more reliable population trees than other distances particularly for microsatellite DNA data.
Euclidean distance
Goldstein distance 1995
It was specifically developed for microsatellite markers and is based on the stepwise-mutation model (SMM).
Nei's minimum genetic distance 1973
This measure assumes that genetic differences arise due to mutation and genetic drift.
Roger's distance 1972
Fixation index
A commonly used measure of genetic distance is the fixation index which varies between 0 and 1. A value of 0 indicates that two populations are genetically identical (minimal or no genetic diversity between the two populations) whereas a value of 1 indicates that two populations are genetically different (maximum genetic diversity between the two populations). No mutation is assumed. Large populations between which there is much migration, for example, tend to be little differentiated whereas small populations between which there is little migration tend to be greatly differentiated. Fst is a convenient measure of this differentiation, and as a result Fst and related statistics are among the most widely used descriptive statistics in population and evolutionary genetics. But Fst is more than a descriptive statistic and measure of genetic differentiation. Fst is directly related to the Variance in allele frequency among populations and conversely to the degree of resemblance among individuals within populations. If Fst is small, it means that allele frequencies within each population are very similar; if it is large, it means that allele frequencies are very different.