
 | ||
The Gallagher index (based on the method of least squares) "measures an electoral system’s relative disproportionality between votes received and seats allotted in a legislature." As such, it measures the difference between the percentage of votes each party gets, and the percentage of seats each party gets in the resulting legislature -- and it measures this dis-proportionality from all parties collectively in one given election. This collective dis-proportionality from this one election is given a precise score, which can then be used in comparing various levels of proportionality among various elections from various electoral systems.
Contents
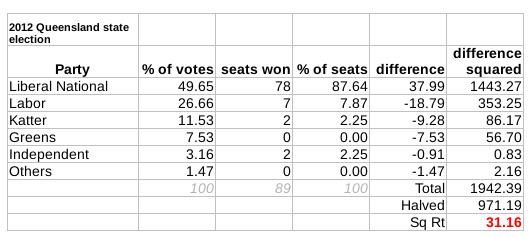
The index involves taking the square root of half the sum of the squares of the difference between percent of vote (
The index weighs the deviations by their own value, creating a responsive index, ranging from 0 to 100. The larger the differences between the percentage of the vote and the percentage of seats summed over all parties, the larger the Gallagher index. The larger the index value the larger the disproportionality and vice versa. Michael Gallagher, who created the index, included "other" parties as a whole category, and Arend Lijphart modified it, excluding those parties. Unlike the well-known Loosemore–Hanby index, the Gallagher index is less sensitive to small discrepancies.
Attention gained in Canada
The Gallagher index gained considerable attention in Canada in December 2016 in the context of efforts to reform Canada's electoral system. The Special Committee on Electoral Reform (a Parliamentary Committee) recommended "that the Government should, as it develops a new electoral system, use the Gallagher index in order to minimize the level of distortion between the popular will of the electorate and the resultant seat allocations in Parliament." The committee recommended that "the government should seek to design a system that achieves a Gallagher score of 5 or less." In the 2015 Canadian federal election, the Gallagher index was 12.02, where 0 would be a perfectly proportional election outcome.
New Zealand
This table uses the New Zealand 2005 election result. Note that since New Zealand uses the MMP voting system, voters have two votes. This list uses the party vote, which determines the proportionality of the House; the electorate vote determines the local member.
Thus the disproportionality of the 2005 New Zealand election is 1.13, which is very low by international standards.
Note that the Māori Party has the highest difference, which is significantly above the others. This is due to New Zealand's system of reserved seats for Māori. The Māori seats are allocated by votes on a separate electoral roll, and while any party can contest these seats, they are generally won by either the Māori Party, the Labour Party, or New Zealand First.
Other indices
The Sainte-Laguë method is considered by Gallagher to be "probably the soundest of all the measures." This is closely related to the Pearson's chi-squared test which has better statistical underpinning.