
Uses Vision testing | ||
 | ||
Related items | ||
An eye chart is a chart used to measure visual acuity. Eye charts are often used by health care professionals, such as optometrists, physicians or nurses, to screen persons for vision impairment. Ophthalmologists, physicians who specialize in the eye, also use eye charts to monitor the visual acuity of their patients in response to various therapies such as medications or surgery.
Contents
The chart is placed at a standardized distance away from the person whose vision is being tested. The person then attempts to identify the symbols on the chart, starting with the larger symbols and continuing with progressively smaller symbols until the person cannot identify the symbols. The smallest symbols that can be reliably identified is considered the person's visual acuity.
The Snellen chart is the most widely used. Alternative types of eye charts include the logMAR chart, Landolt C, E chart, Lea test, Golovin–Sivtsev table, the Rosenbaum chart, and the Jaeger chart.
Procedure
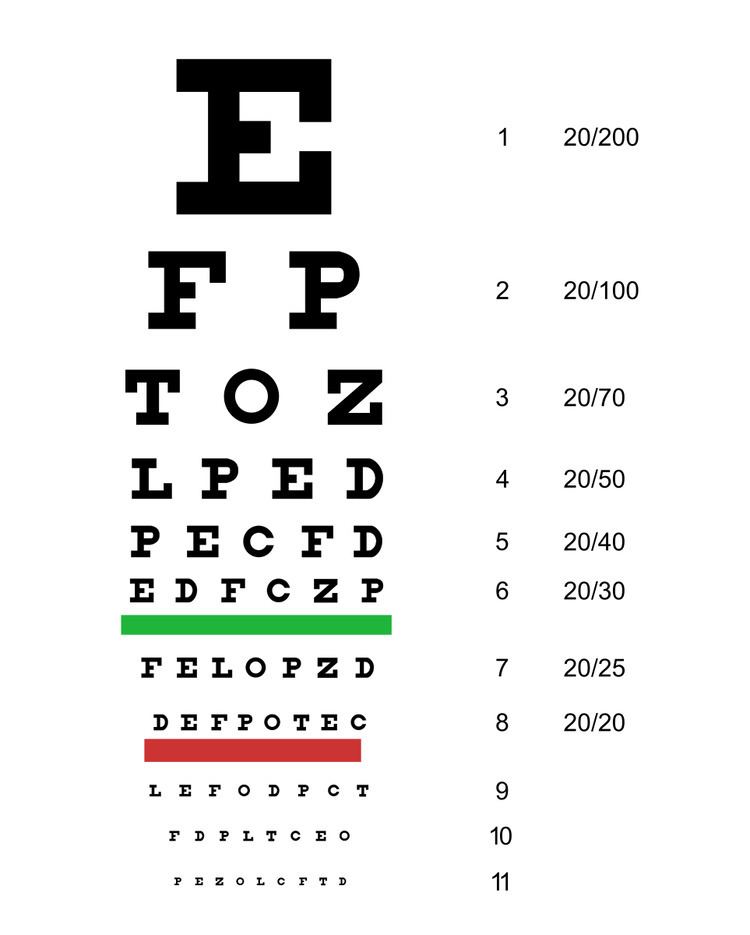
Charts display several rows of optotypes, which are standardized symbols for testing vision. Optotypes are usually letters, numbers, or geometric symbols. Each row of the chart depicts optotypes of a different size. Typically the largest optotypes are in the top row. The optotypes become progressively smaller towards the bottom of the chart.
The person removes any glasses or contacts, and stands or sits a standardized distance from the chart (e.g., 20 feet for the Snellen chart). The person is then asked to identify the optotypes on the chart, starting with large rows and continuing to smaller rows until the optotypes cannot be reliably identified anymore. The row in which the person can reliably identify symbols defines the visual acuity.
One eye is tested at a time. Practically, this is accomplished by covering the other eye with a hand, piece of paper, or a small paddle. After testing without glasses or contacts, testing is repeated while the person wears them, if applicable. Often, the use of such refractive lenses will correct visual acuity to normal. Refractive error can be corrected using a pinhole occluder. If the visual acuity improves with the use of pinholes, refractive lenses can be utilized to improve visual acuity. Squinting can achieve the same effect as a pinhole occluder.
With the Snellen chart, the visual acuity is recorded as a fraction with 20 in the numerator (top number) and values ranging from 10 to 600 in the denominator (bottom number). The denominator indicates the distance at which a person with normal vision could stand to correctly identify the same symbols identified by the person tested. For example, a visual acuity of 20/20 is considered normal. Any visual acuity with a denominator greater than 20 indicates a deficit in visual acuity, with larger denominators reflecting a more severe deficit. Some people have a visual acuity better than normal, such as 20/15.
Technically speaking, testing visual acuity with an eye chart is a psychophysical measurement that attempts to determine a sensory threshold (see also psychometric function).
Variations
Numerous types of eye charts exist and are used in various situations. For example, the Snellen chart is designed for use at 6 meters or 20 feet, and is thus appropriate for testing distance vision. There is often also a need to test a subject's vision at near or occupational tasks (such as reading or computer use). For these situations, a Rosenbaum chart or Jaeger chart can be used.
While the Snellen chart remains the default, some authors have argued that the logMAR chart is superior. The logMAR chart presents the same number of symbols on each line, uses a font with letters that are equally legible at various sizes, and by varying the symbol size logarithmically, it is easier to use at nonstandard distances. As a consequence of these improvements, the logMAR chart has been proposed as a more reliable tool for measuring visual acuity. However, the logMAR chart has not yet been widely adopted.
It can be difficult to measure visual acuity in infants, young children, and illiterate adults. Special eye charts can be used. One version uses simple pictures or patters. Others are printed with the block letter "E" turned in different orientations, the so-called Tumbling E. The patient simply indicates which direction each "E" is facing. The Landolt C chart is similar: rows have circles with different segments missing, and the test-taker describes where each broken piece is located. The last two kinds of charts also reduce the possibility of the patient guessing the images.
Alternatives
Computer-based semi-automatic alternatives to the eye chart have been developed, but are not very common. They have several potential advantages, such as a more precise measurement and less examiner-induced bias.
If the person, particularly a young child, is unable to cooperate with visual acuity testing via an eye chart, practitioners can be alerted to possible deficits in visual acuity by asking parents whether the child appears to see well. A clue is that the child may hold objects close to the face when attempting to focus. Refractive error can be estimated via photography, a technique called photoscreening.