
 | ||
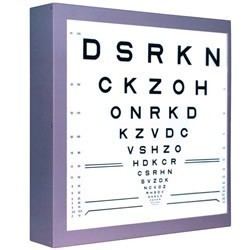
A LogMAR chart comprises rows of letters and is used by optometrists, ophthalmologists and vision scientists to estimate visual acuity. This chart was developed at the National Vision Research Institute of Australia in 1976, and is designed to enable a more accurate estimate of acuity as compared to other charts (e.g., the Snellen chart). For this reason, the LogMAR chart is recommended, particularly in a research setting.
Contents
- History
- Relation to the Snellen chart
- Recording visual acuity using the LogMAR chart
- Advantages of LogMAR over other charts
- Low vision and blindness definition with LogMAR
- References
When using the LogMAR chart, visual acuity is scored with reference to the Logarithm of the Minimum Angle of Resolution, as the chart's name suggests. An observer who can resolve details as small as 1 minute of visual angle scores LogMAR 0, since the base-10 logarithm of 1 is 0; an observer who can resolve details as small as 2 minutes of visual angle (i.e., reduced acuity) scores LogMAR 0.3, since the base-10 logarithm of 2 is 0.3; and so on.
History
The chart was designed by Ian Bailey and Jan E Lovie-Kitchin at the National Vision Research Institute of Australia. They described their motivation for designing the LogMAR chart as follows: "We have designed a series of near vision charts in which the typeface, size progression, size range, number of words per row and spacings were chosen in an endeavour to achieve a standardization of the test task."
Relation to the Snellen chart
The Snellen chart, which dates back to 1862, is also commonly used to estimate visual acuity. A Snellen score of 6/6 (20/20), indicating that an observer can resolve details as small as 1 minute of visual angle, corresponds to a LogMAR of 0 (since the base-10 logarithm of 1 is 0); a Snellen score of 6/12 (20/40), indicating an observer can resolve details as small 2 minutes of visual angle, corresponds to a LogMAR of 0.3 (since the base-10 logarithm of 2 is 0.3), and so on.
Recording visual acuity using the LogMAR chart
Each letter has a score value of 0.02 log units. Since there are 5 letters per line, the total score for a line on the LogMAR chart represents a change of 0.1 log units. The formula used in calculating the score is:
Advantages of LogMAR over other charts
The LogMAR chart is designed to enable more accurate estimates of acuity as compared to other acuity charts (e.g., the Snellen chart). Each line of the LogMAR chart comprises the same number of test letters (effectively standardizing the test across letter size); the Sloan font is used (Sloan letters are approximately equally legible one from another); letter size from line to line varies logarithmically, as does the spacing between lines (making the chart easy to use at nonstandard viewing distances). Furthermore, the final LogMAR score is based on the total of all letters read.
Low vision and blindness definition with LogMAR
The World Health Organization established criteria for low vision using the LogMAR scale. Low vision is defined as a best-corrected visual acuity worse than 0.5 LogMAR but equal or better than 1.3 LogMAR in the better eye. Blindness is defined as a best-corrected visual acuity worse than 1.3 LogMAR.