
 | ||
Forecasting and trading with the elliott wave principle
The Elliott wave principle is a form of technical analysis that finance traders use to analyze financial market cycles and forecast market trends by identifying extremes in investor psychology, highs and lows in prices, and other collective factors. Ralph Nelson Elliott (1871–1948), a professional accountant, discovered the underlying social principles and developed the analytical tools in the 1930s. He proposed that market prices unfold in specific patterns, which practitioners today call "Elliott waves", or simply "waves". Elliott published his theory of market behavior in the book The Wave Principle in 1938, summarized it in a series of articles in Financial World magazine in 1939, and covered it most comprehensively in his final major work, Nature's Laws: The Secret of the Universe in 1946. Elliott stated that "because man is subject to rhythmical procedure, calculations having to do with his activities can be projected far into the future with a justification and certainty heretofore unattainable." The empirical validity of the Elliott Wave Principle remains the subject of debate.
Contents
- Forecasting and trading with the elliott wave principle
- Foundation
- Degree
- Elliott Wave personality and characteristics
- Pattern recognition and fractals
- Elliott wave rules and guidelines
- Fibonacci relationships
- After Elliott
- Rediscovery and current use
- Criticism
- References
Foundation
The Elliott Wave Principle posits that collective investor psychology, or crowd psychology, moves between optimism and pessimism in natural sequences. These mood swings create patterns evidenced in the price movements of markets at every degree of trend or time scale.

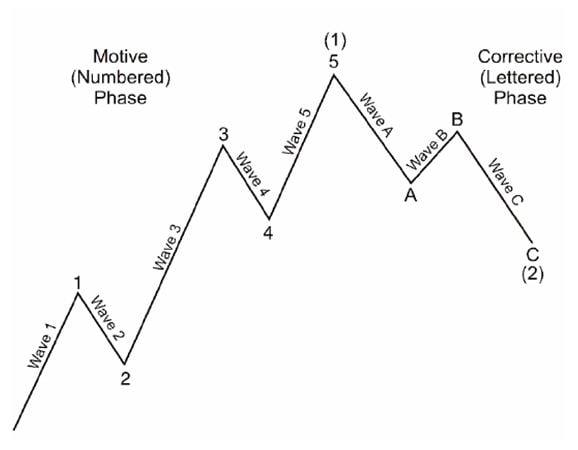
In Elliott's model, market prices alternate between an impulsive, or motive phase, and a corrective phase on all time scales of trend, as the illustration shows. Impulses are always subdivided into a set of 5 lower-degree waves, alternating again between motive and corrective character, so that waves 1, 3, and 5 are impulses, and waves 2 and 4 are smaller retraces of waves 1 and 3. Corrective waves subdivide into 3 smaller-degree waves starting with a five-wave counter-trend impulse, a retrace, and another impulse. In a bear market the dominant trend is downward, so the pattern is reversed—five waves down and three up. Motive waves always move with the trend, while corrective waves move against it.
Degree
The patterns link to form five and three-wave structures which themselves underlie self-similar wave structures of increasing size or higher degree. Note the lowermost of the three idealized cycles. In the first small five-wave sequence, waves 1, 3 and 5 are motive, while waves 2 and 4 are corrective. This signals that the movement of the wave one degree higher is upward. It also signals the start of the first small three-wave corrective sequence. After the initial five waves up and three waves down, the sequence begins again and the self-similar fractal geometry begins to unfold according to the five and three-wave structure which it underlies one degree higher. The completed motive pattern includes 89 waves, followed by a completed corrective pattern of 55 waves.
Each degree of a pattern in a financial market has a name. Practitioners use symbols for each wave to indicate both function and degree—numbers for motive waves, letters for corrective waves (shown in the highest of the three idealized series of wave structures or degrees). Degrees are relative; they are defined by form, not by absolute size or duration. Waves of the same degree may be of very different size and/or duration.
The classification of a wave at any particular degree can vary, though practitioners generally agree on the standard order of degrees (approximate durations given):
Elliott Wave personality and characteristics
Elliott wave analysts (or Elliotticians) hold that each individual wave has its own signature or characteristic, which typically reflects the psychology of the moment. Understanding those personalities is key to the application of the Wave Principle; they are defined below. (Definitions assume a bull market in equities; the characteristics apply in reverse in bear markets.)
Pattern recognition and fractals
Elliott's market model relies heavily on looking at price charts. Practitioners study developing trends to distinguish the waves and wave structures, and discern what prices may do next; thus the application of the Wave Principle is a form of pattern recognition.
The structures Elliott described also meet the common definition of a fractal (self-similar patterns appearing at every degree of trend). Elliott wave practitioners say that just as naturally occurring fractals often expand and grow more complex over time, the model shows that collective human psychology develops in natural patterns, via buying and selling decisions reflected in market prices: "It's as though we are somehow programmed by mathematics. Seashell, galaxy, snowflake or human: we're all bound by the same order."
Critics say it is a form of pareidolia.
Elliott wave rules and guidelines
A correct Elliott wave count must observe three rules:
A common guideline called "alternation" observes that in a five-wave pattern, waves 2 and 4 often take alternate forms; a simple sharp move in wave 2, for example, suggests a complex mild move in wave 4. Corrective wave patterns unfold in forms known as zigzags, flats, or triangles. In turn these corrective patterns can come together to form more complex corrections. Similarly, a triangular corrective pattern is formed usually in wave 4, but very rarely in wave 2, and is the indication of the end of a correction.
Fibonacci relationships
R. N. Elliott's analysis of the mathematical properties of waves and patterns eventually led him to conclude that "The Fibonacci Summation Series is the basis of The Wave Principle". Numbers from the Fibonacci sequence surface repeatedly in Elliott wave structures, including motive waves (1, 3, 5), a single full cycle (8 waves), and the completed motive (89 waves) and corrective (55 waves) patterns. Elliott developed his market model before he realized that it reflects the Fibonacci sequence. "When I discovered The Wave Principle action of market trends, I had never heard of either the Fibonacci Series or the Pythagorean Diagram".
The Fibonacci sequence is also closely connected to the Golden ratio (1.618). Practitioners commonly use this ratio and related ratios to establish support and resistance levels for market waves, namely the price points which help define the parameters of a trend. See Fibonacci retracement.
Finance professor Roy Batchelor and researcher Richard Ramyar, a former Director of the United Kingdom Society of Technical Analysts and formerly Global Head of Research at Lipper and Thomson Reuters Wealth Management, studied whether Fibonacci ratios appear non-randomly in the stock market, as Elliott's model predicts. The researchers said the "idea that prices retrace to a Fibonacci ratio or round fraction of the previous trend clearly lacks any scientific rationale". They also said "there is no significant difference between the frequencies with which price and time ratios occur in cycles in the Dow Jones Industrial Average, and frequencies which we would expect to occur at random in such a time series".
Robert Prechter replied to the Batchelor–Ramyar study, saying that it "does not challenge the validity of any aspect of the Wave Principle...it supports wave theorists' observations," and that because the authors had examined ratios between prices achieved in filtered trends rather than Elliott waves, "their method does not address actual claims by wave theorists". The Socionomics Institute also reviewed data in the Batchelor–Ramyar study, and said these data show "Fibonacci ratios do occur more often in the stock market than would be expected in a random environment".
Extracted from the same relationship between Elliott Waves and Fibonacci ratio, a 78.6% retracement level is identified as a best place for buying or selling (in continuation to the larger trend) as it increases the risk to reward ratio up to 1:3.
It has been suggested that Fibonacci relationships are not the only irrational number based relationships evident in waves.
The GBP/JPY currency chart gives an example of a fourth wave retracement apparently halting between the 38.2% and 50.0% Fibonacci retracements of a completed third wave. The chart also highlights how the Elliott Wave Principle works well with other technical analysis tendencies as prior support (the bottom of wave-1) acts as resistance to wave-4. The wave count depicted in the chart would be invalidated if GBP/JPY moves above or even touches the wave-1 low.
After Elliott
Following Elliott's death in 1948, other market technicians and financial professionals continued to use the Wave Principle and provide forecasts to investors. Charles Collins, who had published Elliott's "Wave Principle" and helped introduce Elliott's theory to Wall Street, ranked Elliott's contributions to technical analysis on a level with Charles Dow.
Hamilton Bolton, founder of The Bank Credit Analyst, also known as BCA Research Inc., provided wave analysis to a wide readership in the 1950s and 1960s through a number of annual supplements of market commentary. He also authored the book "The Elliott Wave Principle of Stock Market Behavior".
Bolton introduced the Elliott Wave Principle to A.J. Frost (1908-1999), who provided weekly financial commentary on the Financial News Network in the 1980s. Over the course of his lifetime Frost's contributions to the field were of great significance and today the Canadian Society of Technical Analysts awards the A.J. Frost Memorial Award to someone each year who has also made a significant contribution to the field of technical analysis.
The first A.J. Frost Memorial Award was awarded to Robert Prechter in 1999, with whom Frost co-authored Elliott Wave Principle in 1978.
Rediscovery and current use
Robert Prechter came across Elliott's works while working as a market technician at Merrill Lynch. His prominence as a forecaster during the bull market of the 1980s brought the greatest exposure to date to Elliott's work, and today Prechter remains the most widely known Elliott analyst.
Among market technicians, wave analysis is widely accepted as a component of their trade. The Elliott Wave Principle is among the methods included on the exam that analysts must pass to earn the Chartered Market Technician (CMT) designation, the professional accreditation developed by the Market Technicians Association (MTA).
Robin Wilkin, Ex-Global Head of FX and Commodity Technical Strategy at JPMorgan Chase, says "the Elliott Wave Principle ... provides a probability framework as to when to enter a particular market and where to get out, whether for a profit or a loss."
Jordan Kotick, Global Head of Technical Strategy at Barclays Capital and past President of the Market Technicians Association, has said that R. N. Elliott's "discovery was well ahead of its time. In fact, over the last decade or two, many prominent academics have embraced Elliott’s idea and have been aggressively advocating the existence of financial market fractals."
One such academic is the physicist Didier Sornette, professor at ETH Zurich. In a paper he co-authored in 1996 ("Stock Market Crashes, Precursors and Replicas") Sornette said,
It is intriguing that the log-periodic structures documented here bear some similarity with the "Elliott waves" of technical analysis ... A lot of effort has been developed in finance both by academic and trading institutions and more recently by physicists (using some of their statistical tools developed to deal with complex times series) to analyze past data to get information on the future. The 'Elliott wave' technique is probably the most famous in this field. We speculate that the "Elliott waves", so strongly rooted in the financial analysts’ folklore, could be a signature of an underlying critical structure of the stock market.
Paul Tudor Jones, the billionaire commodity trader, calls Prechter and Frost's standard text on Elliott "a classic," and one of "the four Bibles of the business":
[Magee and Edwards'] Technical Analysis of Stock Trends and The Elliott Wave Theorist both give very specific and systematic ways to approach developing great reward/risk ratios for entering into a business contract with the marketplace, which is what every trade should be if properly and thoughtfully executed.
Glenn Neely, financial market analyst and author of the book Mastering Elliott Wave, studied the Elliott Wave Principle for years and used it to develop his own forecasting method by expanding on the concepts Elliott created in the 1930s.
Criticism
Benoit Mandelbrot has questioned whether Elliott waves can predict financial markets:
But Wave prediction is a very uncertain business. It is an art to which the subjective judgement of the chartists matters more than the objective, replicable verdict of the numbers. The record of this, as of most technical analysis, is at best mixed.
Robert Prechter had previously stated that ideas in an article by Mandelbrot "originated with Ralph Nelson Elliott, who put them forth more comprehensively and more accurately with respect to real-world markets in his 1938 book The Wave Principle."
Critics also warn the Wave Principle is too vague to be useful, since it cannot consistently identify when a wave begins or ends, and that Elliott wave forecasts are prone to subjective revision. Some who advocate technical analysis of markets have questioned the value of Elliott wave analysis. Technical analyst David Aronson wrote:
The Elliott Wave Principle, as popularly practiced, is not a legitimate theory, but a story, and a compelling one that is eloquently told by Robert Prechter. The account is especially persuasive because EWP has the seemingly remarkable ability to fit any segment of market history down to its most minute fluctuations. I contend this is made possible by the method's loosely defined rules and the ability to postulate a large number of nested waves of varying magnitude. This gives the Elliott analyst the same freedom and flexibility that allowed pre-Copernican astronomers to explain all observed planet movements even though their underlying theory of an Earth-centered universe was wrong.
The Elliott Wave Principle is also thought by some to be too dated to be applicable in today's markets, as explained by market analyst Glenn Neely:
"Elliott wave was an incredible discovery for its time. But, as technologies, governments, economies, and social systems have changed, the behavior of people has also. These changes have affected the wave patterns R.N. Elliott discovered. Consequently, strict application of orthodox Elliott wave concepts to current day markets skews forecasting accuracy. Markets have evolved, but Elliott has not."