
 | ||
Recent advances are improving the speed and accuracy of loss estimates immediately after earthquakes (within less than an hour) so that injured people may be rescued more efficiently. "Casualties" are defined as fatalities and injured people, which are due to damage to occupied buildings. After major and large earthquakes, rescue agencies and civil defense managers rapidly need quantitative estimates of the extent of the potential disaster, at a time when information from the affected area may not yet have reached the outside world. For the injured below the rubble every minute counts. To rapidly provide estimates of the extent of an earthquake disaster is much less of a problem in industrialized than in developing countries. This article focuses on how one can estimate earthquake losses in developing countries in real time.
Contents
- The need for theoretically estimating human losses in real time
- Pinpointing the hypocenter and magnitude
- The race to know about a new earthquake
- Epicenter
- Depth
- Magnitude
- Estimates of shaking
- The intensity of shaking diminishes away from the earthquake
- Built environment
- Deaths from collapsing buildings
- Population at risk in a given quake
- Occupancy rate
- Simplifications
- Averaging
- Models for settlements
- Expected mortality by city district
- Uncertainties in real time estimates
- Existing earthquake loss alert services
- Estimating losses due to tsunami
- Improvements in accuracy
- References
The need for theoretically estimating human losses in real time
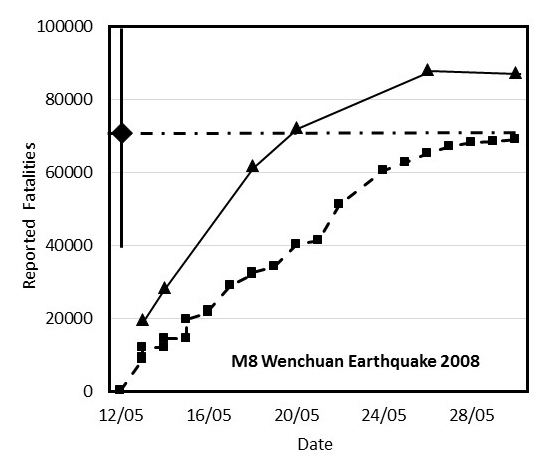
For the first few days after an earthquake, practically no information flows from the center of the devastated area. Examples of the initial underestimation of the extent of earthquake disasters in developing as well as industrialized countries are shown in Figure 1. The responsible experts believed for 4 days that the death toll in the Wenchuan earthquake, Mw 8 of May 12, 2008, was less than 10,000.
Speedy arrivals of medical teams and other first responders is essential for saving injured from dying and helping others to get care. Theoretical estimates of the numbers of fatalities and injured within less than an hour of a large earthquake is the only information that can guide first responders to where and how large a disaster has struck. For this reason, the QLARM and the PAGER teams maintain around the clock capabilities to calculate earthquake damage and casualties within less than 1 hour of any earthquake worldwide. No other groups are capable of these detailed analyses. This page can help medical and other responders understand how fast and how accurate loss estimates can be calculated after earthquakes and what should be added to be more helpful.
The estimates of fatalities distributed by email by the QLARM team of the International Centre for Earth Simulation Foundation (ICES) within 100 minutes of the Wenchuan earthquake was 55,000 ± 30,000, which includes the final toll of about 87,000.
For the 2009 L'Aquila earthquake, an M6.3 earthquake, QLARMs estimate of fatalities was 275 ±200, 22 minutes after the event. The final death toll was 287. In both cases, the official fatality count was slow to reflect the true extent of the disasters. Thus, theoretical estimates of fatalities in real time can be useful for reacting with an appropriate disaster relief response, even though these estimates have large error margins. Current QLARM alerts can be found at, the alarms by the US Geological Survey PAGER team are found at.
Pinpointing the hypocenter and magnitude
The location of an earthquake (its epicenter and depth) needs to be known rapidly for estimating losses. It is calculated from the times at which the waves it generates arrive at seismographs surrounding the source. A computer moves the epicenter estimate close to those stations which record the waves first and far from stations that reported the waves later. This can be done within seconds to accuracies of 1 kilometer in regions where dense seismograph networks exist with inter-station distances of about 10 km. For most of the world, this luxury is not available and the worldwide seismograph network has to be used to estimate the location based on teleseismic data (recorded at distances of more than 1,000 km). This means that estimates of the location cannot be calculated before the waves have traveled hundreds and thousands of kilometers to stations that record them.
The race to know about a new earthquake
The following agencies distribute estimates of latitude, longitude, depth, and magnitude of worldwide earthquakes rapidly and with high accuracy. The Geoforschungszentrum, Potsdam, Germany, delivers automatic solutions within 7 minutes (median) for all major earthquakes worldwide. The National Earthquake Information Center of the United States Geological Survey (USGS) delivers solutions that are reviewed by a seismologist within 18 minutes (median) for all major earthquakes worldwide. The European-Mediterranean Seismological Centre delivers reviewed parameters mostly in the European area within 21 minutes (median). The Pacific Tsunami Warning Center and the National Tsunami Warning Center of the National Oceanic and Atmospheric Administration (NOAA) delivers reviewed parameters for earthquakes in the wider Pacific area within 9 minutes (median). These are updated numbers, slightly shorter than discussed in detail earlier.
Epicenter
If the epicenter is incorrect the loss estimate will be uncertain. Errors are introduced in the estimate of position mostly because of the heterogeneity of the Earth. Seismic waves travel with different speeds in different rocks. Uncertainties in real time epicenters estimated by teleseismic means are ±25 km (median).
Depth
The depth is important, but uncertain in the top 50 km. The depths of earthquakes range from 0 to about 700 km. Generally, only the earthquakes in the top 100 km are close enough to settlements to cause casualties. The decrease of the wave amplitudes as a function of distance (Figure 2) shows that dangerous intensities, I≥VII, do not exist beyond 30 to 50 km for major earthquakes. Thus, deep earthquakes are usually not of interest for alerts.
The depth of the energy release can be estimated accurately (to within 1 km) if a seismograph station right above the earthquake (or near it) records the waves. This is usually not the case and one has to rely on teleseismic methods to estimate the depth.
The teleseismic method is to measure the time delay with which the wave reflected from the Earth’s surface above the earthquake arrives at a seismograph. The surface of the Earth acts like a mirror. A wave that runs up against it cannot travel into the air, so it is reflected back down into the Earth, traveling to the same seismograph that recorded the direct wave a little bit earlier. The time delay of the reflected wave depends of course directly on the extra distance it has traveled: from the hypocenter up to the surface and back down to the depth of the hypocenter.
This method works fine, if the hypocentral depth Z>50 km because, in that case, the direct and reflected phases (waves) are clearly separated on the record. For shallower depths, the delay is so small that the two pulses on the seismogram are not readily recognizable as separate pulses; it takes filtering techniques to separate and identify them.
It follows that the depth of the shallow earthquakes, those most dangerous, must be assumed to be 25 ±25 km, if there is no other evidence available. This uncertainty is approximately the same as that of the epicenter. There exists a possibility to reduce this error based on historic data, in some cases. For regions where the tectonic style and the faults producing the earthquakes are well known, one may chose a depth assuming it is the same as in past earthquakes for which the depth had been determined accurately.
Magnitude
For earthquake with magnitudes smaller than M7.5, the different agencies mentioned above as issuing location estimates, usually distribute values of M within 0.2 units from each other. For these medium-sized earthquake, the average of the estimates is a reliable determination of the earthquake size. However, for great earthquakes approaching M8 and exceeding it, the initial estimate of M is often significantly too small. This is so because the surface wave M, which is quickly obtained, is defined as proportional to the 20 sec Reighly surface wave, and this wave has a wavelength of about 100 km. It is therefore too short to reliably measure the M of an earthquake rupture exceeding 100 km. In thee cases, an in depth analysis, which takes time, is needed to arrive at the correct M.
As an example, the Wenchuan earthquake of 12 May 2008 had originally been assigned M7.5 in real-time. Later estimates were M7.9 to M8.0. Based on the first estimate, fatalities had been expected to reach a maximum of 4,000, based on the second the maximum had been calculated as 100,000. The observed number of fatalities in this case was 87,000, determined after months (see Figure in the introduction of this page).
Estimates of shaking
The magnitude for great earthquakes is often underestimated, at first. The standard teleseismic measure of the ‘size’ of an earthquake is the surface wave magnitude, Ms, which has to be derived by definition from the surface waves with 20 second period. A more reliable and more modern scale is that of the moment magnitude, Mw.
Variations of the amplitudes recorded at different seismograph stations are due to many reasons, but the mean magnitude derived from reports by many stations that have recorded the earthquake should be fairly stable. Nevertheless, the agencies which report source parameters (GFZ, NEIC, TWC. EMSC) differ in their magnitude estimates by 0.2 units, on average. This value is taken as the uncertainty of the magnitude estimate in real time.
There exists a special problem for great earthquakes; those with M>8. The waves with 20 seconds period, which define Ms, have wavelengths of only about 100 km. This means, they are too short a yardstick to measure the size of ruptures that significantly exceed 100 km in length. For this reason Mw was introduced, being based on wavelengths of about 1000 km. Unfortunately, these long wavelengths do not become available as fast as shorter ones, resulting in initial underestimates of the magnitude of great earthquakes. As an example, for the Tohoku, M9 earthquake of 11 March 2011, the initial estimates were: GFZ M8.5, NEIC M7.9, TWC M7.9, and EMSC M8.0.
The intensity of shaking diminishes away from the earthquake
Strong ground motions damage buildings, sometimes bringing about collapse. Shaking of the ground decreases with distance from the release of energy, the hypocenter, or, more accurately expressed, from the entire area of rupture. To calculate the intensity of shaking at a given settlement, the computer looks up the attenuation (decrease in amplitude) for seismic waves that travel the distance to the settlement in question.
Errors are again introduced through the heterogeneity of the Earth. The loss of energy along the wave path is not exactly the same in all parts of the world. Examples are shown in Figure 2. For poorly studied regions in developing countries, the uncertainty of the estimated intensities can be substantial, as shown by the different curves, because attenuation is poorly known.
Another factor that can lead to variations of observed intensity of shaking is the condition of the soil beneath a particular structure. The waves are amplified in unconsolidated soils compared to hard rock (Figure 3). In important cities, soil conditions and their amplification factors are mapped for microzonation purposes. This type of information is usually not available for settlements in developing countries. One has to assume that the mixture of conditions results in an average loss estimate for the city, overall.
An intensity, I, given in Roman numerals from I to XII, is calculated for each settlement, accounting for the magnitude of the earthquake and its distance, and also accounting for the local amplification, if known.
Built environment
The built environment is poorly known for some countries. The quality of buildings differs by country and settlement size. For estimating damage to the built environment, one needs to calculate the damage expected for each type of building present in a given settlement. For each settlement one needs to know the distribution of buildings into classes with different resistance to strong shaking. A common scale for classifying building types is the European Macroseismic Scale (EMS98)
The distribution of building types is different in industrialized and developing countries (Figure 4) and also in villages compared to cities in the same country. Many earthquake engineers work on the problem of better defining the world data on building properties (World Housing Encyclopedia).
After one knows the distribution of buildings into classes (histograms on the left in both frames of Figure 4), one needs to estimate how the population is distributed into these building types (histograms on the right in both frames of Figure 4). These distributions are not identical because the higher quality houses tend to shelter more people per building.
The Haiti earthquake, M7.3 of 12 January 2010 showed that in this case the quality of construction was vastly underestimated by the engineering community. Each new damaging earthquake serves as a source of new information on building properties in the region. In the immediate aftermath of the Haiti earthquake of 12 January 2010, a joint study for the estimation of damage to the building stock based on aerial images was carried out by UNITAR-UNOSAT, the EC-JRC, and the World Bank/ImageCAT in support of the PDNA. Hancilar et al. (2013) have developed empirical fragility functions based on remote sensing and field data for the pre-dominant building typologies (http://earthquakespectra.org/doi/abs/10.1193/121711EQS308M). The international project Global Earthquake Model (GEM) has the aim of producing a world map of earthquake risk. As part of this gigantic effort, data sets will be improved, which are also needed for real time loss assessments. One of these is the data set on world housing properties.
Deaths from collapsing buildings
The probability that a building of a given type may collapse if subjected to a certain intensity of shaking (Figure 5) is an important parameter for calculating expected human losses. The weak buildings that are present in developing countries (Figure 4 on the left) are the ones that are likely to collapse at moderate intensities (Figure 5 on the left).
The numbers of fatalities and injured (casualties are the sum of these two parameters) are estimated, using a casualty matrix, a table which gives the percentages of dead, injured, and unscathed among the occupants of a building that collapses. This distribution depends strongly on the building type.
A building need not collapse to injure and kill; at every damage degree there exists a probability that casualties will result.
The data in casualty matrices are so poorly known that we cannot give uncertainties here. However, specialists are working on learning more about this and related problems in estimating losses due to earthquakes.
Population at risk in a given quake
One would think that one can simply look up the population in all settlements of a country in its census. However, that is not the case for the countries we are targeting. Data sources on the web include the World Gazetteer, the National Geospatial-Intelligence Agency (NGA), and GeoNames for population by settlements. However, these lists are incomplete, omitting small settlements. In many countries the sum of the population listed by the above-mentioned organizations equals only 50% to 80% of the total population as estimated in The World Factbook of the CIA. Also, many settlements are listed without coordinates, and others with coordinates but not population.
Occupancy rate
Variations of occupancy rate as a function of the time of day and the season. The worst time for an earthquake to strike is the night because most of the population is indoors. The time when the consequences are less serious are the morning and evening hours, when farmers are out of doors and office and factory workers are commuting. The fluctuations in occupancy rate have been estimate to be about 35%.
In areas with strong seasonal tourism, the population may fluctuate up to a factor of 10. These fluctuations depend strongly on the location. Currently, there exists no worldwide dataset to account for this effect in loss estimates.
Simplifications
Simplifications are needed because the world is too large for details everywhere.
Averaging
If one wanted to estimate in real time what damage is to be expected for critical facilities (e.g. a nuclear power plant, a high dam of a reservoir, bridges, hospitals, schools) one would have to know quite a few additional details. For example, the type of soil the facility is resting on, the blueprints of the construction to calculate its response to different frequency waves, and the frequency spectrum radiated by the earthquake. It can be done, but it is costly. In developing countries, not all of this information is available.
In estimating losses in real time, one must take advantage of the fact that some buildings are built to code, others are not, some are located on hard rock, others on unconsolidated sediments, and the earthquake may radiate more energy in one direction than in another. Summing up expected losses assuming average conditions may end up approximately correct, although local fluctuations in the results exist.
Models for settlements
Photographs taken from space or from air planes are very useful for assembling a database for the built environment of a city. Even on images which have not been enhanced the size and type of buildings, as well as the building use can clearly be identified (Figure 6). Neighborhoods of residential buildings all of similar construction, and industrial zones can be mapped.
The height of buildings can be estimated from the shadows they cast in photographs from space and from the air. Based on height, estimates 3D models of cities can be constructed, as shown in the example of Central Bucharest (Figure 7). Governmental office buildings can be seen at the center, whereas small residential buildings dominate in the East.
Adding photographs of the facades shot from street level, detailed, realistic models of cities can be built (Figure 8). With this added information, it is possible to better classify the construction type of each building and to deepen the detail of the model of the built environment necessary for accurate estimates of losses due to earthquakes.
However, the number of settlements in the world for which population data are available exceeds one million. For each, coordinates, name, and an estimated population is available, but it is impossible to analyze all of them in the detail as shown in Figures 6, 7, and 8. There is no choice, but to place the entire population at one coordinate point, regardless of the settlement’s size, and to assign each settlement a standard distribution of buildings into classes of different earthquake resistance. The only refinement one can afford is to have different standard models for different countries and for at least three settlement size for each country.
In an ideal case, one would like to have detailed information on every building and its occupants. However, with thousands of large cities at risk and hundreds of millions of inhabitants in them, this is too costly. A cost-effective way to model a large city is to treat each administrative district as a separate settlement.
Expected mortality by city district
In many large cities, the census contains information on population and building stock by district. A model of a city in which each district has its own distribution of buildings into classes and its population, is far superior to the basic, primitive model of one coordinate point. If one has the resources to divide a large city into neighborhoods containing similar building stock, then a high quality model can be constructed at a still moderate cost. An example of the mortality rate estimates in case of a future M8 earthquake off Lima, Peru, shows that there are substantial differences between districts (Figure 9). The differences are due to the distance from the assumed source, the type of soil, and the quality of the building stock. In addition to the mortality calculation for the entire population, information on the locations and expected damage state of schools, hospitals, fire stations, police posts, and critical facilities would be of great value for rescuers. However, to develop this type of information requires a more substantial effort in countries where the location and construction quality of these facilities are not known.
Calculating the likely functionality of hospitals after earthquakes requires specialized expertise. In some cities, elaborate efforts by commercial enterprises have been carried out or are under way to catalog information on a neighborhood level, more detailed than shown in Figure 9. In industrial countries details of each house with street address are often known.
Uncertainties in real-time estimates
Uncertainties in real-time estimates of human losses are a factor of two, at best. One may group the seriousness for introducing errors in the loss estimates due to uncertain input, into three classes: serious, moderate, and negligible.
The size of the most serious errors is an order of magnitude (meaning a factor of 10). They can be generated by hypocenter errors, incorrect data on building stock, and magnitude errors for M>8 earthquakes. Wrong assumptions on the attenuation of seismic waves may introduce errors of a factor of 3.
Moderate errors, typically about 30%, can be introduced by variations of magnitude for M<8, soil conditions, and directivity of energy radiated. Other inaccuracies in data sets or input contribute errors that are negligible compared to the aforementioned uncertainties.
Existing earthquake loss alert services
By email, the QLARM team is distributing estimates of human losses (numbers of fatalities and injured), in addition to calculations of mean damage for each settlement in their database, following earthquakes worldwide since October 2003. Up to May 2010, these estimates were based on a program and data set called QUAKELOSS, since that time the alerts are based on the second generation tool and data set called QLARM, including a map showing the mean damage expected for affected settlements. The first 10 years of near-real-time earthquake alerts by this team can be found in. Recent alerts can be found on the web page of the International Centre for Earth Simulation Foundation (ICES), Geneva http://icesfoundation.org/Pages/QlarmEventList.aspx.
The National Earthquake Information Center of the USGS has been issuing PAGER alerts by email since April, 2009. They contain a color code reflecting the seriousness of the event, the number of people estimated to have been exposed to the various likely intensity levels, tectonic information about the epicentral area, and consequences that had resulted from previous nearby earthquakes.
Global Disaster Alert and Coordination System (GDACS)) has been issuing color-coded earthquake alerts since September 2005. These reports contain comments on the socio-economic conditions of the epicentral area. As a measure of the level of seriousness, they use only the number of people within set radii of distance. This information can be misleading because the parameters, which control the extent of a disaster, are ignored (magnitude, depth, transmission properties, building stock characteristics, and time of day).
Estimating losses due to tsunami
The methods explained here concern only losses due to strong ground motions. Damage due to tsunamis is not included. The community researching tsunamis is currently struggling with the problem of making a rapid decision after an earthquake whether or not a tsunami has been generated, how high it might be in the open ocean, and finally what local run ups should be expected. Methods to calculate what happens to the built environment when a wave strikes are not yet developed.
Improvements in accuracy
Human losses can be estimated with sufficient accuracy to assist disaster response to mobilize in adequate ways. Inconsequential events can be identified in 99% of the cases, which means that rescue teams do not need to waste time and energy to needlessly mobilize. Although the uncertainties in estimating human losses in real time are large, they allow one to immediately identify disastrous cases that need attention. Some of the uncertainties in the input parameters cannot be improved and will remain as error sources. However, the uncertainty in other parameters, especially databases, can be reduced by research. Some of the important parameters have hardly been investigated. Because many people are working on this problem, real time estimates of human losses after earthquakes will become more accurate and more useful.