
 | ||
The dependency network approach provides a system level analysis of the activity and topology of directed networks. The approach extracts causal topological relations between the network's nodes (when the network structure is analyzed), and provides an important step towards inference of causal activity relations between the network nodes (when analyzing the network activity). This methodology has originally been introduced for the study of financial data, it has been extended and applied to other systems, such as the immune system, and semantic networks.
Contents
- Importance
- Overview
- The node node correlations
- Partial correlations
- The correlation influence and correlation dependency
- Node activity dependencies
- The structure dependency networks
- Node structural dependencies
- Visualization of the Dependency Network
- References
In the case of network activity, the analysis is based on partial correlations, which are becoming ever more widely used to investigate complex systems. In simple words, the partial (or residual) correlation is a measure of the effect (or contribution) of a given node, say j, on the correlations between another pair of nodes, say i and k. Using this concept, the dependency of one node on another node, is calculated for the entire network. This results in a directed weighted adjacency matrix, of a fully connected network. Once the adjacency matrix has been constructed, different algorithms can be used to construct the network, such as a threshold network, Minimal Spanning Tree (MST), Planar Maximally Filtered Graph (PMFG), and others.
Importance
The partial correlation based Dependency Networks is a revolutionary new class of correlation based networks, which is capable of uncovering hidden relationships between the nodes of the network.
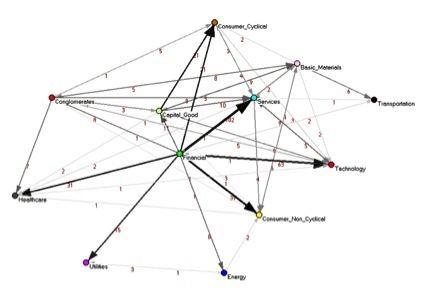
This original methodology was first presented at the end of 2010, published in the highly cited PLoS ONE journal. This research, headed by Dror Y. Kenett and his Ph.D. supervisor Prof. Eshel Ben-Jacob, collaborated with Dr. Michele Tumminello and Prof. Rosario Mantegna. They quantitatively uncovered hidden information about the underlying structure of the U.S. stock market, information that was not present in the standard correlation networks. One of the main results of this work is that for the investigated time period (2001–2003), the structure of the network is dominated by companies belonging to the financial sector, which are the hubs in the dependency network. Thus, they were able for the first time to quantitatively show the dependency relationships between the different economic sectors. Following this work, the dependency network methodology has been applied to the study of the immune system, and semantic networks. As such, this methodology is applicable to any complex system.
Overview
To be more specific, the partial correlations of the pair, given j is the correlations between them after proper subtraction of the correlations between i and j and between k and j. Defined this way, the difference between the correlations and the partial correlations provides a measure of the influence of node j on the correlation. Therefore, we define the influence of node j on node i, or the dependency of node i on node j- D(i,j), to be the sum of the influence of node j on the correlations of node i with all other nodes.
In the case of network topology, the analysis is based on the effect of node deletion on the shortest paths between the network nodes. More specifically, we define the influence of node j on each pair of nodes (i,k) to be the inverse of the topological distance between these nodes in the presence of j minus the inverse distance between them in the absence of node j. Then we define the influence of node j on node i, or the dependency of node i on node j - D(i,j), to be the sum of the influence of node j on the distances between node i with all other nodes k.
The node-node correlations
The node=node correlations can be calculated by Pearson’s formula:
Where
Partial correlations
Next we use the resulting node correlations to compute the partial correlations. The first order partial correlation coefficient is a statistical measure indicating how a third variable affects the correlation between two other variables. The partial correlation between nodes i and k with respect to a third node
where
The correlation influence and correlation dependency
The relative effect of the correlations
Node activity dependencies
Next, we define the total influence of node j on node i, or the dependency D(i,j) of node i on node j to be:
As defined,D(i,j) is a measure of the average influence of node j on the correlations C(i,k) over all nodes k not equal to j. The node activity dependencies define a dependency matrix D whose (i,j) element is the dependency of node i on node j. It is important to note that while the correlation matrix C is a symmetric matrix, the dependency matrix D is nonsymmetrical –
The structure dependency networks
The path influence and distance dependency: The relative effect of node j on the directed path
Node structural dependencies
Next, we define the total influence of node j on node i, or the dependency D(i,j) of node i on node j to be:
As defined, D(i,j) is a measure of the average influence of node j on the directed paths from node i to all other nodes k. The node structural dependencies define a dependency matrix D whose (i,j) element is the dependency of node i on node j, or the influence of node j on node i. It is important to note that the dependency matrix D is nonsymmetrical –
Visualization of the Dependency Network
The Dependency matrix is the weighted adjacency matrix, representing the fully connected network. Different algorithms can be applied to filter the fully connected network to obtain the most meaningful information, such as using a threshold approach, or different pruning algorithms. A widely used method to construct informative sub-graph of a complete network is the Minimum Spanning Tree (MST). Another informative sub-graph, which retains more information (in comparison to the MST) is the Planar Maximally Filtered Graph (PMFG) which is used here. Both methods are based on hierarchical clustering and the resulting sub-graphs include all the N nodes in the network whose edges represent the most relevant association correlations. The MST sub-graph contains