
Life expectancy 60 years (2013 est.) | ||
 | ||
Population 86,613,986 (2013 est.)(14th)[1] Growth rate 2.9% (2013 est.) (12th) Birth rate 33.5 births/1,000 population (2012 est.) [2] Death rate 7.8 deaths/1,000 population (2012 est.) Fertility rate 4.6 children born/woman (2012 est.) | ||
The demographics of Ethiopia encompass the demographic features of Ethiopia's inhabitants, including ethnicity, languages, population density, education level, health, economic status, religious affiliations and other aspects of the population.
Contents
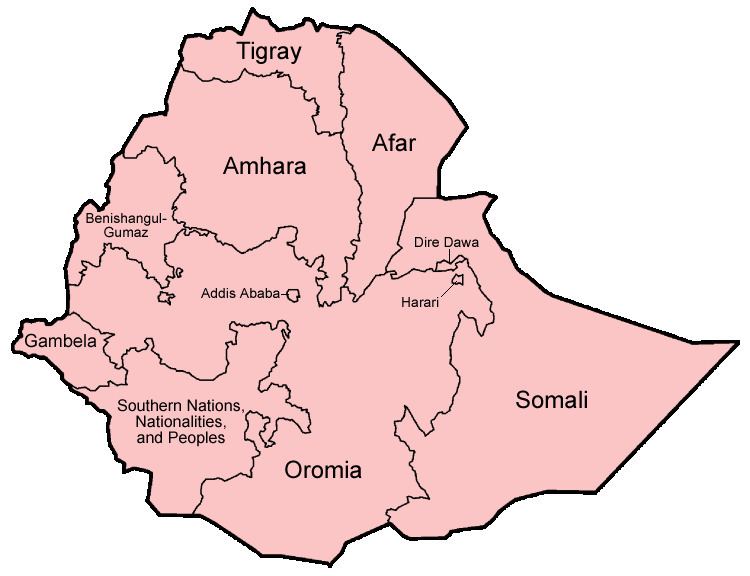
- Map of Ethiopia
- Ethnic groups
- Languages
- Religions
- Population
- UN estimates
- UN projections
- Vital statistics
- Total Fertility rate in Ethiopia Census 2007
- Fertility and Births Demographic and Health Surveys
- CIA World Factbook demographic statistics
- References
Map of Ethiopia
Ethnic groups
The country's population is highly diverse, containing over 80 different ethnic groups. Most people in Ethiopia speak Afroasiatic languages, mainly of the Semitic or Cushitic branches. Among these are the Oromo, Amhara, Somali and Tigray, who together constitute around three-quarters of the population.
Nilo-Saharan-speaking Nilotic ethnic minorities also inhabit the southern regions of the country, particularly in areas bordering South Sudan. Among these are the Mursi and Anuak.
Languages
According to Ethnologue, there are 90 individual languages spoken in Ethiopia. The 1994 Ethiopian census indicates that some 77 tongues were spoken locally. Most of these languages belong to the Afro-Asiatic family (Cushitic and Semitic). Omotic languages are also spoken, though their classification is uncertain. Additionally, Nilo-Saharan languages are spoken by the nation's Nilotic ethnic minorities.
According to the 2007 Ethiopian census, the most widely spoken first languages are: Oromo (33.8%), Amharic (29.33%), Somali (6.25%), and Tigrinya (5.86%).
Amharic 29.33%% (as a first language), Oromo 31.6%, Somali 6.5%, Tigrinya 6.1%, Gurage 3.5%, Sidamo 3.5%, other local languages; Arabic and English (major foreign language taught in schools),
Amharic is the only official national language of Ethiopia. It was also the language of primary school instruction, but has been replaced in many areas by local languages such as Oromo and Tigrinya. English is the most widely spoken foreign language, and is officially " the taught in all secondary schools".
Religions
Various religions are adhered to in Ethiopia. Most Christians live in the highlands, whereas Muslims mainly inhabit the lowlands. Adherents of traditional faiths are primarily concentrated in the southern regions.
According to the Ethiopian Central Statistical Agency (2007 census), the national religious composition is Ethiopian Orthodox 43.5%, Muslim 33.9%, Protestant 18.6%, traditional 2.6%, Catholic 0.7%, all others 0.6%.
Population
Source: Central Statistical Agency (CSA)
UN estimates
According to the 2010 revision of the UN's World Population Prospects, the total population was 82,950,000 in 2010, compared to 18,434,000 in 1950. The proportion of children below the age of 15 in 2010 was 41.5%, 55.8% was between 15 and 65 years of age, while 3.3% was 65 years or older.The average age is 25.1.
UN projections
Below are the UN's medium variant projections; numbers are in thousands:
Vital statistics
Registration of vital events in Ethiopia is incomplete. The Population Department of the United Nations prepared the following estimates:
CBR = crude birth rate (per 1,000); CDR = crude death rate (per 1,000); NC = natural change (per 1,000); IMR = infant mortality rate per 1,000 births; TFR = total fertility rate (number of children per woman)
Births and deaths
Total Fertility rate in Ethiopia (Census 2007)
As per 2007 Population and Housing Census of Ethiopia
Fertility and Births (Demographic and Health Surveys)
Total Fertility Rate (TFR) (Wanted Fertility Rate) and Crude Birth Rate (CBR):
According to 2011 official survey, total fertility rate was 4.8 with 2.6 in Urban and 5.5 in rural regions. Total wanted fertility rate (TWFR) in Ethiopia is 3.0 children per woman, this suggests that the TFR is 60 percent higher than it would be if unwanted births were avoided.
Fertility data as of 2011 (DHS Program):
CIA World Factbook demographic statistics
The following demographic statistics are from the CIA World Factbook, unless otherwise indicated.
Population
99,465,819Age structure
0-14 years: 43.94% (male 21,900,571/female 21,809,643) 15-24 years: 19.98% (male 9,865,976/female 10,009,596) 25-54 years: 29.31% (male 14,487,280/female 14,667,179) 55-64 years: 3.88% (male 1,882,315/female 1,981,762) 65 years and over: 2.88% (male 1,289,336/female 1,572,161) (2015 est.)Median age
total: 17.7 years male: 17.5 years female: 17.8 years (2015 est.)Population growth rate
2.89% (2015 est.)Birth rate
37.27 births/1,000 population (2015 est.)Death rate
8.19 deaths/1,000 population (2015 est.)Net migration rate
-0.22 migrant(s)/1,000 populationUrbanization
urban population: 19.5% of total population (2015) rate of urbanization: 4.89% annual rate of change (2010-15 est.)Sex ratio
at birth: 1.03 male(s)/female 0-14 years: 1 male(s)/female 15-24 years: 0.99 male(s)/female 25-54 years: 0.99 male(s)/female 55-64 years: 0.95 male(s)/female 65 years and over: 0.82 male(s)/female total population: 0.99 male(s)/female (2015 est.)Life expectancy at birth
total population: 61.48 years male: 59.11 years female: 63.93 years (2015 est.)Total fertility rate
5.15 children born/woman (2015 est.)HIV/AIDS
adult prevalence rate: 1.15% people living with HIV/AIDS: 730,300 deaths: 23,400 (2014 est.)Literacy
definition: age 15 and over can read and write total population: 49.1% male: 57.2% female: 41.1% (2015 est.)