
 | ||
As per 2011 Census of India, Bihar is third most populated state of India with total population of 103,804,637 (54,185,347 Male and 49,619,290 Female) Only 11.3% of the population of Bihar lives in urban areas, which is lowest in India after Himachal Pradesh.
Contents
Key data
Religious demographics
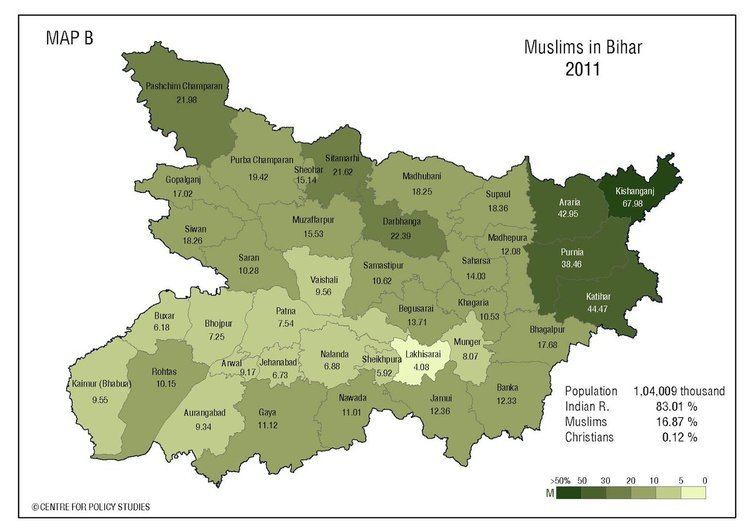
Sum total in above table is 103998509, while population in 2011 census was 104099452. Hinduism is practiced by 82.77% of the population and forms the majority religion in the state. Islam is practiced by 16.9% of the population, and other religions nearly 0.2% only.
Caste demographics
Linguistic demographics
Hindi and Urdu are the official languages of the state, whilst the majority of the people speak one of the Bihari languages - Bhojpuri, Magadhi, Maithili or Angika. Bhojpuri and Magahi are sometimes considered dialects of Hindi, while Maithili and Angika are not. Maithili is also one of the recognised regional language of India as per the Eighth Schedule of the Constitution of India.
Educational Demographics
Bihar has a total literacy rate of 69.83%. Overall Male and Female literacy rate is 70.32% and 53.57% respectively. Total Rural literacy rate is 43.9%. In rural areas of Bihar, Male and Female literacy rate is 57.1 and 29.6 respectively. Total Urban literacy rate is 71.9. In urban areas of Bihar, Male and Female literacy rate is 79.9 and 62.6 respectively. . Total number of literates in Bihar is 3,16,75,607 which consists 2,09,78,955 Male and 1,06,96,652 Female. Patna has highest Literacy Rate of 63.82% followed by Rohtas (62.36%) and Munger (60.11%). Kishanganj has lowest Literacy Rate of 31.02% followed by Araria (34.94%) and Katihar (35.29%).
Economical demographics
The economy of Bihar is largely service orientated, but it also has a significant agricultural base. The state also has a small industrial sector. As of today, agriculture accounts for 35%, industry 9% and service 55% of the economy of the state
Ethnic groups
Bihar's major ethnic group is Indo-aryans.