
 | ||
In economics, the demand curve is the graph depicting the relationship between the price of a certain commodity and the amount of it that consumers are willing and able to purchase at any given price. It is a graphic representation of a market demand schedule. The demand curve for all consumers together follows from the demand curve of every individual consumer: the individual demands at each price are added together, assuming independent decision-making.
Contents
- Characteristics
- Linear demand curve
- Shift
- Demand shifters
- Changes that decrease demand
- Factors affecting market demand
- Movement along a demand curve
- Discreteness of amounts
- Units of measurement
- Price elasticity of demand PED
- Taxes and subsidies
- References
Demand curves are used to estimate behaviors in competitive markets, and are often combined with supply curves to estimate the equilibrium price (the price at which sellers together are willing to sell the same amount as buyers together are willing to buy, also known as market clearing price) and the equilibrium quantity (the amount of that good or service that will be produced and bought without surplus/excess supply or shortage/excess demand) of that market. In a monopolistic market, the demand curve facing the monopolist is simply the market demand curve.
Demand curves are usually considered as theoretical structures that are expected to exist in the real world, but real world measurements of actual demand curves are difficult and rare.
Characteristics
According to convention, the demand curve is drawn with price on the vertical (y) axis and quantity on the horizontal (x) axis. The function actually plotted is the inverse demand function.
The demand curve usually slopes downwards from left to right; that is, it has a negative association. The negative slope is often referred to as the "law of demand", which means people will buy more of a service, product, or resource as its price falls. The demand curve is related to the marginal utility curve, since the price one is willing to pay depends on the utility. However, the demand directly depends on the income of an individual while the utility does not. Thus it may change indirectly due to change in demand for other commodities.
However, with Veblen goods, such as status symbols, the utility value of the good is largely the price and demand is higher at higher prices and the demand curve may curve upwards. With a Giffen good the price is taken by the market as a signal of quality, irrespective of the true nature of the product, and hence demand may be very low when priced low and increase at higher price points.
Linear demand curve
The demand curve is often graphed as a straight line of the form Q = a − bP where a and b are parameters. The constant "a" embodies the effects of all factors other than price that affect demand. If income were to change, for example, the effect of the change would be represented by a change in the value of "a" and be reflected graphically as a shift of the demand curve. The constant "b" is the slope of the demand curve and shows how the price of the good affects the quantity demanded.
The graph of the demand curve uses the inverse demand function in which price is expressed as a function of quantity. The standard form of the demand equation can be converted to the inverse equation by solving for P or P = a/b − Q/b.
More plainly, in the equation P = a − bQ, "a" is the intercept where price is zero (where the demand curve intercepts the X-axis), "b" is the slope of the demand curve, "Q" is quantity and "P" is price.
There is movement along a demand curve when a change in price causes the quantity demanded to change. It is important to distinguish between movement along a demand curve, and a shift in a demand curve. Movements along a demand curve happen only when the price of the good changes. When a non-price determinant of demand changes the curve shifts. These "other variables" are part of the demand function. They are "merely lumped into intercept term of a simple linear demand function." Thus a change in a non-price determinant of demand is reflected in a change in the x-intercept causing the curve to shift along the x axis.
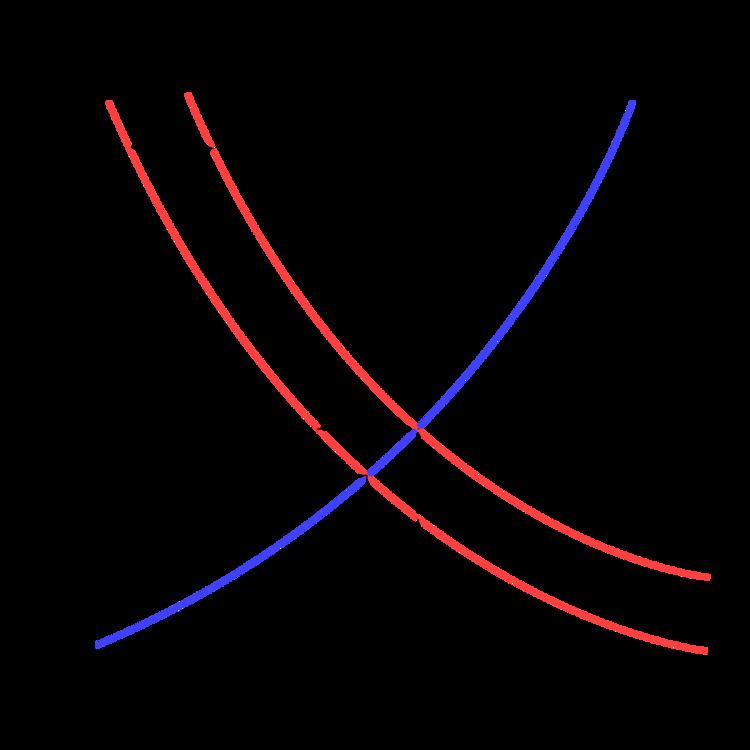
Shift
The shift of a demand curve takes place when there is a change in any non-price determinant of demand, resulting in a new demand curve. Non-price determinants of demand are those things that will cause demand to change even if prices remain the same—in other words, the things whose changes might cause a consumer to buy more or less of a good even if the good's own price remained unchanged. Some of the more important factors are the prices of related goods (both substitutes and complements), income, population, and expectations. However, demand is the willingness and ability of a consumer to purchase a good under the prevailing circumstances; so, any circumstance that affects the consumer's willingness or ability to buy the good or service in question can be a non-price determinant of demand. As an example, weather could be a factor in the demand for beer at a baseball game.
When income increases, the demand curve for normal goods shifts outward as more will be demanded at all prices, while the demand curve for inferior goods shifts inward due to the increased attainability of superior substitutes. With respect to related goods, when the price of a good (e.g. a hamburger) rises, the demand curve for substitute goods (e.g. chicken) shifts out, while the demand curve for complementary goods (e.g. tomato sauce) shifts in (i.e. there is more demand for substitute goods as they become more attractive in terms of value for money, while demand for complementary goods contracts in response to the contraction of quantity demanded of the underlying good).
Demand shifters
Changes that decrease demand
Circumstances which can cause the demand curve to shift to the left include:
Factors affecting market demand
Market or aggregate demand is the summation of individual demand curves. In addition to the factors which can affect individual demand there are three factors that can affect market demand (cause the market demand curve to shift):
Some circumstances which can cause the demand curve to shift in include:
Movement along a demand curve
There is movement along a demand curve when a change in price causes the quantity demanded to change. It is important to distinguish between movement along a demand curve, and a shift in a demand curve. Movements along a demand curve happen only when the price of the good changes. When a non-price determinant of demand changes the curve shifts. These "other variables" are part of the demand function. They are "merely lumped into intercept term of a simple linear demand function." Thus a change in a non-price determinant of demand is reflected in a change in the x-intercept causing the curve to shift along the x axis.
Discreteness of amounts
If a commodity is sold in whole units, and these are valuable for a consumer, then the individual demand curve can hardly be approximated by a continuous curve. It is a set function of the price, defined by a price above which no unit is bought, a price range for which one is bought, etc.
Units of measurement
If the local currency is dollars, for example, then the units of measurement of the variable "price" are "dollars per unit of the good" and the units of measurement of "quantity" are "units of the good per time (e.g., per week or per year). Thus quantity demanded is a flow variable.
Price elasticity of demand (PED)
PED is a measure of the sensitivity of the quantity variable, Q, to changes in the price variable, P. Elasticity answers the question of how much the quantity will change in percentage terms for a 1% change in the price, and is thus important in determining how revenue will change.
The elasticity of demand indicates how sensitive the demand for a good is to a price change. If the PED is between zero and 1, demand is said to be inelastic; if PED equals 1, the demand is unitary elastic; and if the Price elasticity of demand is greater than 1, demand is elastic. A low coefficient implies that changes in price have little influence on demand. A high elasticity indicates that consumers will respond to a price rise by buying a lot less of the good and that consumers will respond to a price cut by buying a lot more...
Taxes and subsidies
A sales tax on the commodity does not directly change the demand curve, if the price axis in the graph represents the price including tax. Similarly, a subsidy on the commodity does not directly change the demand curve, if the price axis in the graph represents the price after deduction of the subsidy.
If the price axis in the graph represents the price before addition of tax and/or subtraction of subsidy then the demand curve moves inward when a tax is introduced, and outward when a subsidy is introduced.