
Elevation 454 m Population 1,875 (31 Dec 2008) | SFOS number 5816 Postal code 1562 Local time Monday 9:13 AM | |
 | ||
Weather 6°C, Wind SW at 24 km/h, 79% Humidity | ||
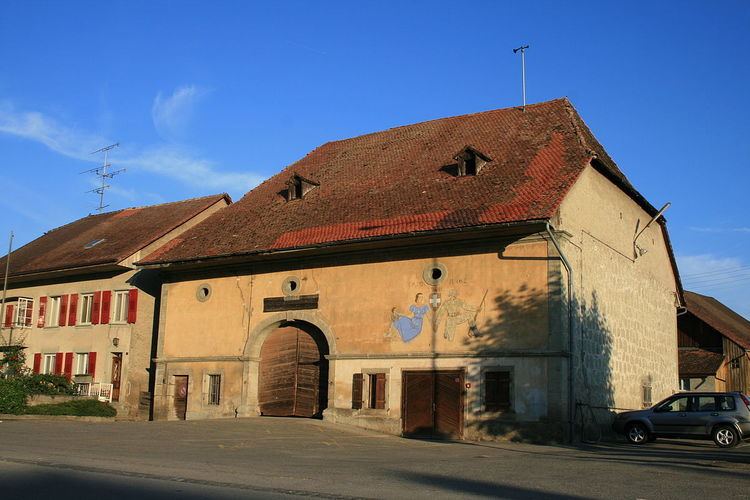
Corcelles-près-Payerne is a municipality in the district of Broye-Vully in the canton of Vaud in Switzerland.
Contents
- Map of 1562 Corcelles prC3A8s Payerne Switzerland
- History
- Geography
- Coat of arms
- Demographics
- Politics
- Economy
- Religion
- Education
- References
Map of 1562 Corcelles-pr%C3%A8s-Payerne, Switzerland
History
Corcelles-près-Payerne is first mentioned in 1235 as Corsales.
Geography
Corcelles-près-Payerne has an area, as of 2009, of 12.13 square kilometers (4.68 sq mi). Of this area, 10.01 km2 (3.86 sq mi) or 82.5% is used for agricultural purposes, while 0.53 km2 (0.20 sq mi) or 4.4% is forested. Of the rest of the land, 1.32 km2 (0.51 sq mi) or 10.9% is settled (buildings or roads), 0.2 km2 (0.077 sq mi) or 1.6% is either rivers or lakes and 0.08 km2 (20 acres) or 0.7% is unproductive land.
Of the built up area, industrial buildings made up 1.7% of the total area while housing and buildings made up 4.9% and transportation infrastructure made up 3.6%. Out of the forested land, 2.9% of the total land area is heavily forested and 1.5% is covered with orchards or small clusters of trees. Of the agricultural land, 73.5% is used for growing crops and 8.0% is pastures, while 1.1% is used for orchards or vine crops. All the water in the municipality is flowing water.
The municipality was part of the Payerne District until it was dissolved on 31 August 2006, and Corcelles-près-Payerne became part of the new district of Broye-Vully.
The municipality is located on the old highway toward Bern. As it has expanded, it has grown together with Payerne.
Coat of arms
The blazon of the municipal coat of arms is Per pale Argent and Gules, overall a tobacco plant proper.
Demographics
Corcelles-près-Payerne has a population (as of December 2015) of 2,233. As of 2008, 15.7% of the population are resident foreign nationals. Over the last 10 years (1999–2009 ) the population has changed at a rate of 15.5%. It has changed at a rate of 11.2% due to migration and at a rate of 4.5% due to births and deaths.
Most of the population (as of 2000) speaks French (1,464 or 89.1%), with German being second most common (90 or 5.5%) and Portuguese being third (25 or 1.5%). There are 18 people who speak Italian.
Of the population in the municipality 586 or about 35.6% were born in Corcelles-près-Payerne and lived there in 2000. There were 383 or 23.3% who were born in the same canton, while 403 or 24.5% were born somewhere else in Switzerland, and 205 or 12.5% were born outside of Switzerland.
In 2008 there were 13 live births to Swiss citizens and 4 births to non-Swiss citizens, and in same time span there were 17 deaths of Swiss citizens and 1 non-Swiss citizen death. Ignoring immigration and emigration, the population of Swiss citizens decreased by 4 while the foreign population increased by 3. There were 2 Swiss men and 5 Swiss women who immigrated back to Switzerland. At the same time, there were 17 non-Swiss men and 14 non-Swiss women who immigrated from another country to Switzerland. The total Swiss population change in 2008 (from all sources, including moves across municipal borders) was an increase of 8 and the non-Swiss population increased by 37 people. This represents a population growth rate of 2.5%.
The age distribution, as of 2009, in Corcelles-près-Payerne is; 227 children or 12.0% of the population are between 0 and 9 years old and 252 teenagers or 13.3% are between 10 and 19. Of the adult population, 194 people or 10.3% of the population are between 20 and 29 years old. 290 people or 15.4% are between 30 and 39, 319 people or 16.9% are between 40 and 49, and 207 people or 11.0% are between 50 and 59. The senior population distribution is 204 people or 10.8% of the population are between 60 and 69 years old, 119 people or 6.3% are between 70 and 79, there are 66 people or 3.5% who are between 80 and 89, and there are 10 people or 0.5% who are 90 and older.
As of 2000, there were 660 people who were single and never married in the municipality. There were 811 married individuals, 89 widows or widowers and 84 individuals who are divorced.
As of 2000, there were 693 private households in the municipality, and an average of 2.3 persons per household. There were 240 households that consist of only one person and 47 households with five or more people. Out of a total of 718 households that answered this question, 33.4% were households made up of just one person and there were 6 adults who lived with their parents. Of the rest of the households, there are 181 married couples without children, 222 married couples with children There were 37 single parents with a child or children. There were 7 households that were made up of unrelated people and 25 households that were made up of some sort of institution or another collective housing.
In 2000 there were 213 single family homes (or 52.5% of the total) out of a total of 406 inhabited buildings. There were 95 multi-family buildings (23.4%), along with 82 multi-purpose buildings that were mostly used for housing (20.2%) and 16 other use buildings (commercial or industrial) that also had some housing (3.9%). Of the single family homes 39 were built before 1919, while 25 were built between 1990 and 2000. The most multi-family homes (32) were built before 1919 and the next most (11) were built between 1981 and 1990. There were 11 multi-family houses built between 1996 and 2000.
In 2000 there were 773 apartments in the municipality. The most common apartment size was 4 rooms of which there were 216. There were 28 single room apartments and 231 apartments with five or more rooms. Of these apartments, a total of 656 apartments (84.9% of the total) were permanently occupied, while 78 apartments (10.1%) were seasonally occupied and 39 apartments (5.0%) were empty. As of 2009, the construction rate of new housing units was 1.1 new units per 1000 residents. The vacancy rate for the municipality, in 2010, was 0.7%.
The historical population is given in the following chart:
Politics
In the 2007 federal election the most popular party was the FDP which received 25.49% of the vote. The next three most popular parties were the SVP (24.28%), the SP (18.02%) and the LPS Party (16.26%). In the federal election, a total of 618 votes were cast, and the voter turnout was 50.6%.
Economy
As of 2010, Corcelles-près-Payerne had an unemployment rate of 3.2%. As of 2008, there were 128 people employed in the primary economic sector and about 43 businesses involved in this sector. 232 people were employed in the secondary sector and there were 23 businesses in this sector. 139 people were employed in the tertiary sector, with 40 businesses in this sector. There were 855 residents of the municipality who were employed in some capacity, of which females made up 40.0% of the workforce.
In 2008 the total number of full-time equivalent jobs was 424. The number of jobs in the primary sector was 91, of which 88 were in agriculture and 3 were in forestry or lumber production. The number of jobs in the secondary sector was 219 of which 181 or (82.6%) were in manufacturing and 38 (17.4%) were in construction. The number of jobs in the tertiary sector was 114. In the tertiary sector; 71 or 62.3% were in wholesale or retail sales or the repair of motor vehicles, 4 or 3.5% were in the movement and storage of goods, 13 or 11.4% were in a hotel or restaurant, 1 was in the information industry, 4 or 3.5% were technical professionals or scientists, 10 or 8.8% were in education and 2 or 1.8% were in health care.
In 2000, there were 203 workers who commuted into the municipality and 605 workers who commuted away. The municipality is a net exporter of workers, with about 3.0 workers leaving the municipality for every one entering. Of the working population, 7.7% used public transportation to get to work, and 65.4% used a private car.
Religion
From the 2000 census, 502 or 30.5% were Roman Catholic, while 897 or 54.6% belonged to the Swiss Reformed Church. Of the rest of the population, there were 12 members of an Orthodox church (or about 0.73% of the population), and there were 27 individuals (or about 1.64% of the population) who belonged to another Christian church. There were 30 (or about 1.82% of the population) who were Islamic. 99 (or about 6.02% of the population) belonged to no church, are agnostic or atheist, and 77 individuals (or about 4.68% of the population) did not answer the question.
Education
In Corcelles-près-Payerne about 608 or (37.0%) of the population have completed non-mandatory upper secondary education, and 159 or (9.7%) have completed additional higher education (either university or a Fachhochschule). Of the 159 who completed tertiary schooling, 66.0% were Swiss men, 21.4% were Swiss women, 6.9% were non-Swiss men and 5.7% were non-Swiss women.
In the 2009/2010 school year there were a total of 278 students in the Corcelles-près-Payerne school district. In the Vaud cantonal school system, two years of non-obligatory pre-school are provided by the political districts. During the school year, the political district provided pre-school care for a total of 155 children of which 83 children (53.5%) received subsidized pre-school care. The canton's primary school program requires students to attend for four years. There were 153 students in the municipal primary school program. The obligatory lower secondary school program lasts for six years and there were 122 students in those schools. There were also 3 students who were home schooled or attended another non-traditional school.
As of 2000, there were 3 students in Corcelles-près-Payerne who came from another municipality, while 231 residents attended schools outside the municipality.