
 | ||
Coalescent theory is a retrospective stochastic model of population genetics that relates genetic diversity in a sample to demographic history of the population from which it was taken. That is, it is a model of the effect of genetic drift, viewed backwards in time, on the genealogy of antecedents.[1] It comprises a probabilistic assessment of variation in time to common ancestry of alleles in a relatively small sample of individuals, from a much larger population. This includes consideration of all pathways of inheritance through which sampled copies of a homologous DNA element are traced back to a single ancestral copy, known as the most recent common ancestor (MRCA; sometimes also termed the coancestor to emphasize the coalescent relationship). The inheritance relationships among alleles are typically represented as a gene genealogy, or gene tree, similar in form to a phylogenetic tree. The probabilistic expectation of this gene genealogy is also known as the coalescent. Understanding the statistical properties of the coalescent under different assumptions forms the basis of coalescent theory. Because of recombination, different gene loci follow different pathways of ancestry, resulting in different gene genealogies. The coalescent is also relevant to phylogenetics, as incomplete lineage sorting between speciation events results in conflict among gene-loci in phylogenetic relationships inferred among species.
Contents
- Time to coalescence
- Neutral variation
- Graphical representation
- Disease gene mapping
- The genomic distribution of heterozygosity
- History
- Software
- References
The mathematical theory of the coalescent was originally developed in the early 1980s by John Kingman.[2] In the simplest case, coalescent theory assumes no recombination, no natural selection, and no gene flow or population structure. The gene genealogy is independent of the mutational process, such that changes in the DNA sequence do not affect inheritance and can be considered separately (even if all gene copies are identical in sequence they are not equally related in the gene tree). Under this model, the expected time between successive coalescence events, by which two gene copies arise from a single ancestral copy, increases almost exponentially back in time (with wide variance). Advances in coalescent theory include recombination, selection, and virtually any arbitrarily complex evolutionary or demographic model in population genetic analysis.
Time to coalescence
Consider a single gene locus sampled from two haploid individuals in a population. The ancestry of this sample is traced backwards in time to the point where these two lineages coalesce in their MRCA. Coalescent theory seeks to estimate the expectation of this time period and its variance.
The probability that two lineages coalesce in the immediately preceding generation is the probability that they share a parental DNA sequence. In a population with a constant effective population size with 2Ne copies of each locus, there are 2Ne "potential parents" in the previous generation. Under a random mating model, the probability that two alleles originate from the same parental copy is thus 1/(2Ne) and, correspondingly, the probability that they do not coalesce is 1 − 1/(2Ne).
At each successive preceding generation, the probability of coalescence is geometrically distributed — that is, it is the probability of noncoalescence at the t − 1 preceding generations multiplied by the probability of coalescence at the generation of interest:
For sufficiently large values of Ne, this distribution is well approximated by the continuously defined exponential distribution
This is mathematically convenient as the standard exponential distribution has both the expected value and the standard deviation equal to 2Ne; therefore, although the expected time to coalescence is 2Ne, actual coalescence times have a wide range of variation. Note that coalescent time is the number of preceding generations where the coalescence took place and not calendar time though an estimation of the latter can be made multiplying 2Ne with the average time between generations. The above calculations apply equally to a diploid population of effective size Ne (in other words, for a non-recombining segment of DNA, each chromosome can be treated as equivalent to an independent haploid individual; in the absence of inbreeding, sister chromosomes in a single individual are no more closely related than two chromosomes randomly sampled from the population). Some effectively haploid DNA elements, such as mitochondrial DNA, however, are only carried by one sex and therefore have one quarter the effective size of the equivalent diploid population (Ne/2)
Neutral variation
Coalescent theory can also be used to model the amount of variation in DNA sequences expected from genetic drift and mutation. This value is termed the mean heterozygosity, represented as
For
Graphical representation
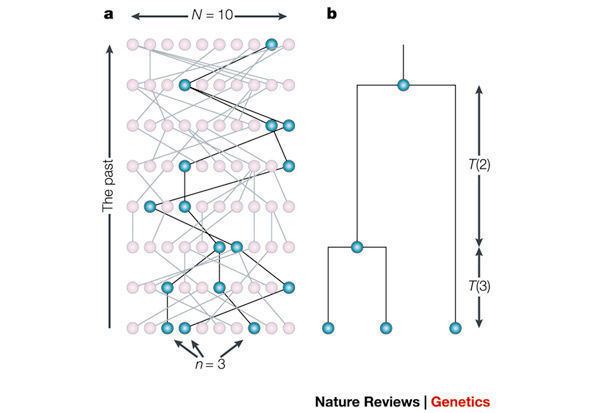
Coalescents can be visualised using dendrograms which show the relationship of branches of the population to each other. The point where two branches meet indicates a coalescent event.
Disease gene mapping
The utility of coalescent theory in the mapping of disease is slowly gaining more appreciation; although the application of the theory is still in its infancy, there are a number of researchers who are actively developing algorithms for the analysis of human genetic data that utilise coalescent theory.[3][4][5]
The genomic distribution of heterozygosity
The human single-nucleotide polymorphism (SNP) map has revealed large regional variations in heterozygosity, more so than can be explained on the basis of (Poisson-distributed) random chance.[6] In part, these variations could be explained on the basis of assessment methods, the availability of genomic sequences, and possibly the standard coalescent population genetic model. Population genetic influences could have a major influence on this variation: some loci presumably would have comparatively recent common ancestors, others might have much older genealogies, and so the regional accumulation of SNPs over time could be quite different. The local density of SNPs along chromosomes appears to cluster in accordance with a variance to mean power law and to obey the Tweedie compound Poisson distribution.[7] In this model the regional variations in the SNP map would be explained by the accumulation of multiple small genomic segments through recombination, where the mean number of SNPs per segment would be gamma distributed in proportion to a gamma distributed time to the most recent common ancestor for each segment.[8]
History
Coalescent theory is a natural extension of the more classical population genetics concept of neutral evolution and is an approximation to the Fisher–Wright (or Wright–Fisher) model for large populations. It was discovered independently by several researchers in the 1980s.[9][10][11][12]
Software
A large body of software exists for both simulating data sets under the coalescent process as well as inferring parameters such as population size and migration rates from genetic data.