
 | ||
A dendrogram (from Greek dendro "tree" and gramma "drawing") is a tree diagram frequently used to illustrate the arrangement of the clusters produced by hierarchical clustering. Dendrograms are often used in computational biology to illustrate the clustering of genes or samples, sometimes on top of heatmaps.
Clustering example
For a clustering example, suppose this data is to be clustered using Euclidean distance as the distance metric.
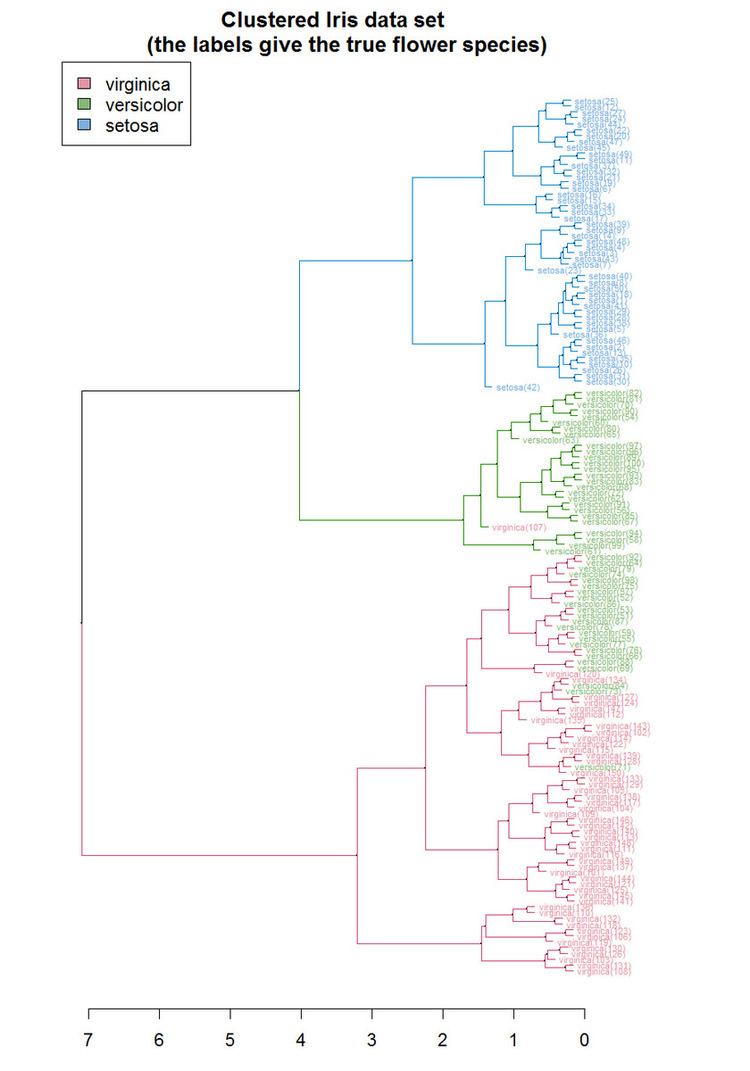
The hierarchical clustering dendrogram would be as such:
The top row of nodes represents data (individual observations), and the remaining nodes represent the clusters to which the data belong, with the arrows representing the distance (dissimilarity).
The distance between merged clusters is monotone increasing with the level of the merger: the height of each node in the plot is proportional to the value of the intergroup dissimilarity between its two daughters (the top nodes representing individual observations are all plotted at zero height).