
Alma mater Ecole Polytechnique Name Charles Minard | Role Civil engineer Education Ecole Polytechnique | |
 | ||
Known for Carte figurative des pertes successives en hommes de l'Armee Francaise dans la campagne de Russie 1812-1813' Fields Civil Engineering, Infographic | ||
Charles Joseph Minard
Charles Joseph Minard ([minaʁ]; 27 March 1781 – 24 October 1870) was a French civil engineer recognized for his significant contribution in the field of information graphics in civil engineering and statistics. Minard was, among other things, noted for his representation of numerical data on geographic maps.
Contents
- Charles Joseph Minard
- The Greatest Ever Infographic Numberphile
- Early life
- Work as a civil engineer
- Work
- Recognition
- References
The Greatest Ever Infographic - Numberphile
Early life
Minard was born in Dijon in the Saint Michel Parish. He was the son of Pierre Etienne Minard and Bénigne Boiteux. His father was a clerk of the court and an officer of the secondary school. Minard was baptized at Saint Michel on the day of his birth. He was very bright and his father encouraged him to study at an early age. At age four he learned to read and to write, and when he was six his father enrolled him an elementary course in anatomy. He completed his fourth year of study at the secondary school at Dijon early, and then applied himself to studying Latin, literature, and physical and math sciences. At age 15 and a half, he was admitted to the prestigious École Polytechnique, and then he studied civil engineering at École nationale des ponts et chaussées.
Work as a civil engineer
In September 1810 he was sent by the government to Antwerp and then almost immediately to the port of Flessingue. There, he solved a critical problem with a cofferdam that was leaking water faster than it could be removed. He solved the problem by using pumps driven by a steam engine, only the third time this solution had been applied to a project.
He worked for many years as a civil engineer on the construction of dams, canals and bridge projects throughout Europe. On November 1, 1830, he was named superintendent of the School of Bridges and Roads, where he continued to serve through 1836. While there he was awarded the cross of the Legion of Honor. He then became inspector of the Corps of Bridges until he retired in 1851, after which he dedicated himself to private research.
Work
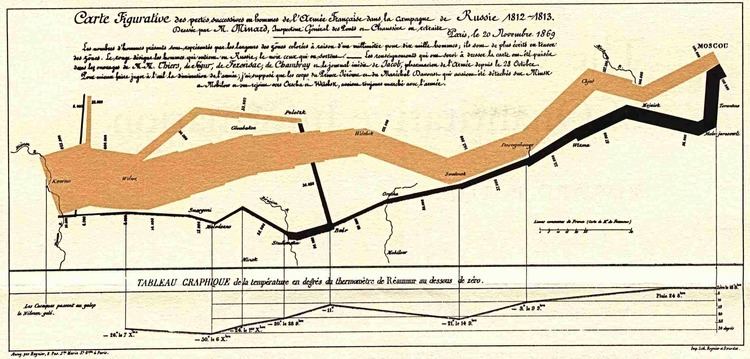
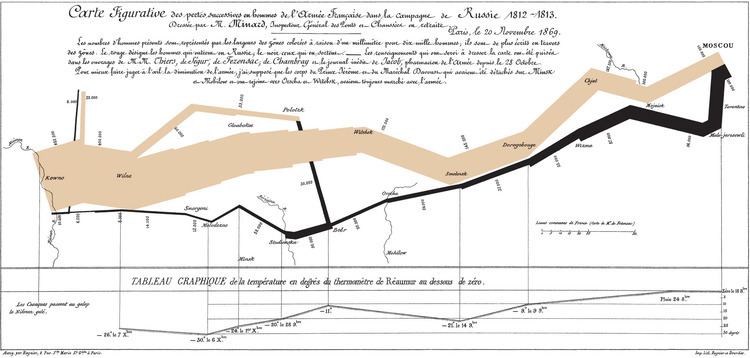
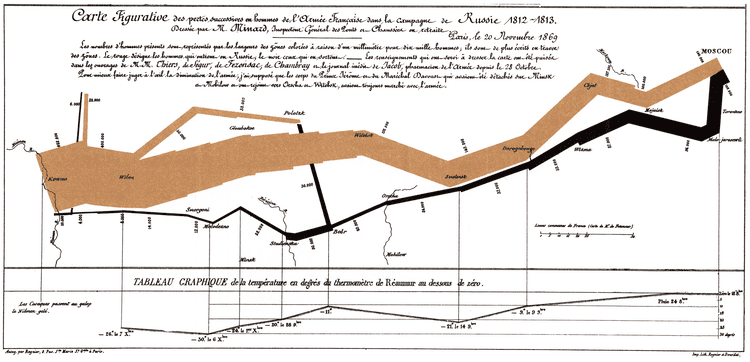
Minard was a pioneer of the use of graphics in engineering and statistics. He is most well known for his cartographic depiction of numerical data on a map of Napoleon's disastrous losses suffered during the Russian campaign of 1812 (in French, Carte figurative des pertes successives en hommes de l'Armée Française dans la campagne de Russie 1812-1813). The illustration depicts Napoleon's army departing the Polish-Russian border. A thick band illustrates the size of his army at specific geographic points during their advance and retreat. It displays six types of data in two dimensions: the number of Napoleon's troops; the distance traveled; temperature; latitude and longitude; direction of travel; and location relative to specific dates without making mention of Napoleon; Minard's interest lay with the travails and sacrifices of the soldiers. This type of band graph for illustration of flows was later called a Sankey diagram, although Matthew Henry Phineas Riall Sankey used this visualisation 30 years later and only for thematic energy flow.
The original description in French accompanying the map translated to English:
Figurative Map of the successive losses in men of the French Army in the Russian campaign 1812-1813.
Drawn by M. Minard, Inspector General of Bridges and Roads (retired). Paris, November 20, 1869.
The numbers of men present are represented by the widths of the colored zones at a rate of one millimeter for every ten thousand men; they are further written across the zones. The red designates the men who enter Russia, the black those who leave it. — The information which has served to draw up the map has been extracted from the works of M.M. Thiers, de Ségur, de Fezensac, de Chambray and the unpublished diary of Jacob, the pharmacist of the Army since October 28th.
In order to better judge with the eye the diminution of the army, I have assumed that the troops of Prince Jérôme and of Marshal Davout, who had been detached at Minsk and Mogilev and have rejoined near Orsha and Vitebsk, had always marched with the army.
Recognition
Modern information scientists say the illustration may be the best statistical graphic ever drawn. French scientist, physiologist and chronophotographer Étienne-Jules Marey first called notice to Minard's dramatic depiction of the fate of Napoleon's army in the Russian campaign, saying it "defies the pen of the historian in its brutal eloquence".
Noted information designer Edward Tufte says it "may well be the best statistical graphic ever drawn" and uses it as a prime example in The Visual Display of Quantitative Information. Howard Wainer identified Minard's map as a "gem" of information graphics, nominating it as the "World's Champion Graph".
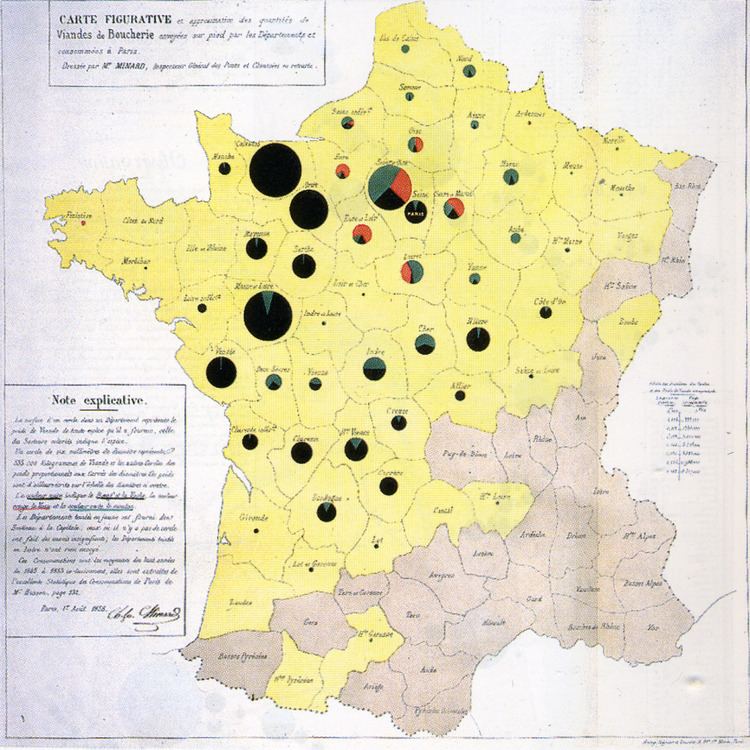
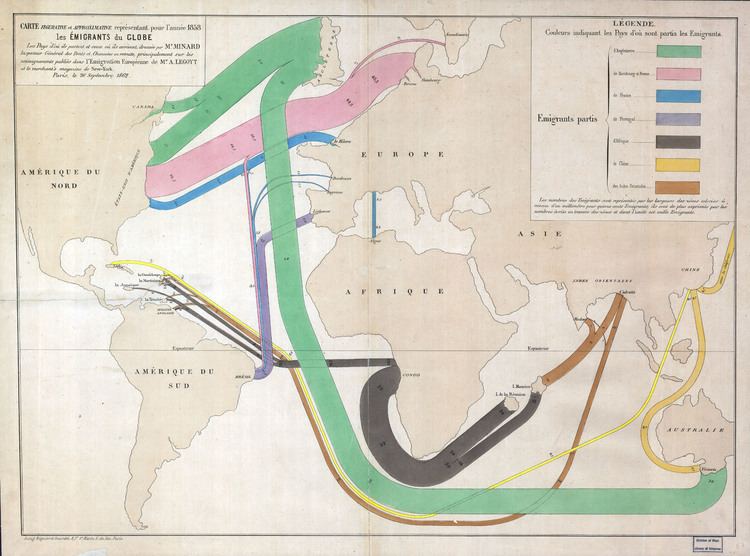
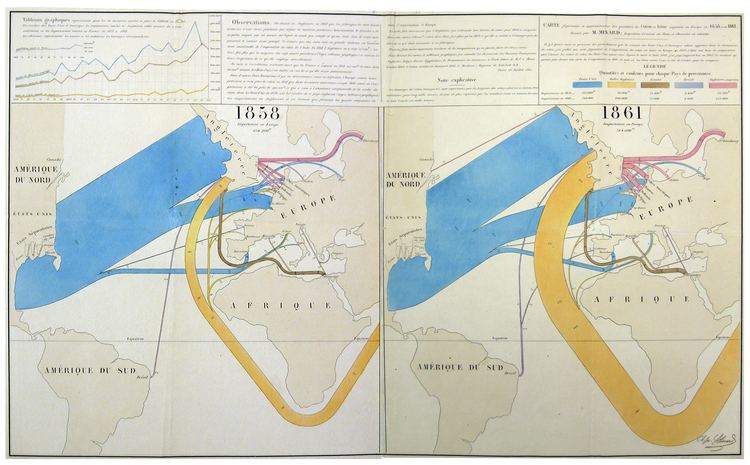
Arthur H. Robinson wrote that Minard was 'a cartographic pioneer in many respects' and pointed out that his famous map (of Napoleon's march) was only one of 51 thematic maps he created during his lifetime.