
Quality characteristic type Attributes data Size of shift to detect ≥ 1.5σ | Rational subgroup size n > 1 Underlying distribution | |
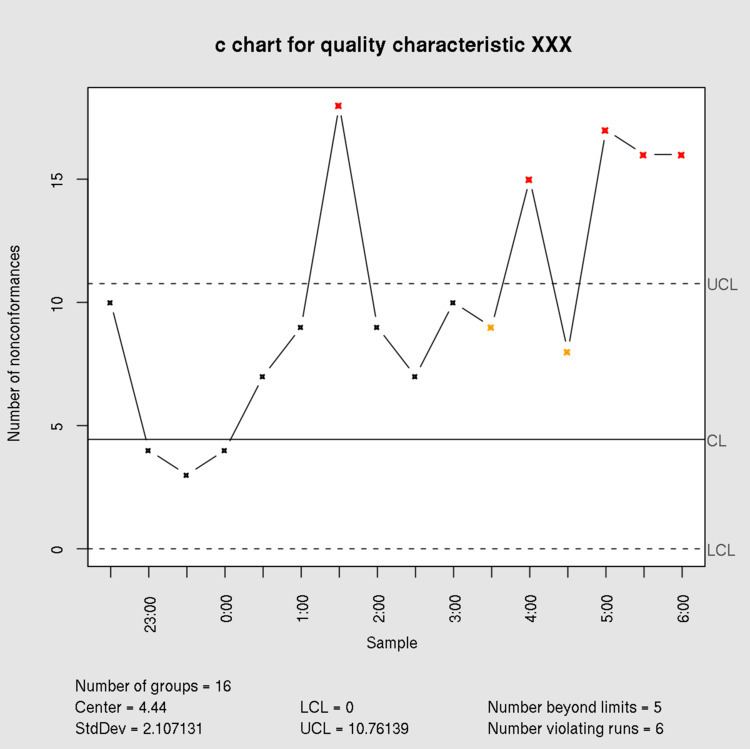 | ||
Measurement type Number of nonconformances in a sample | ||
In statistical quality control, the c-chart is a type of control chart used to monitor "count"-type data, typically total number of nonconformities per unit. It is also occasionally used to monitor the total number of events occurring in a given unit of time.
The c-chart differs from the p-chart in that it accounts for the possibility of more than one nonconformity per inspection unit, and that (unlike the p-chart and u-chart) it requires a fixed sample size. The p-chart models "pass"/"fail"-type inspection only, while the c-chart (and u-chart) give the ability to distinguish between (for example) 2 items which fail inspection because of one fault each and the same two items failing inspection with 5 faults each; in the former case, the p-chart will show two non-conformant items, while the c-chart will show 10 faults.
Nonconformities may also be tracked by type or location which can prove helpful in tracking down assignable causes.
Examples of processes suitable for monitoring with a c-chart include:
The Poisson distribution is the basis for the chart and requires the following assumptions:
The control limits for this chart type are